## Chart Type: Comparative Line Graphs
### Overview
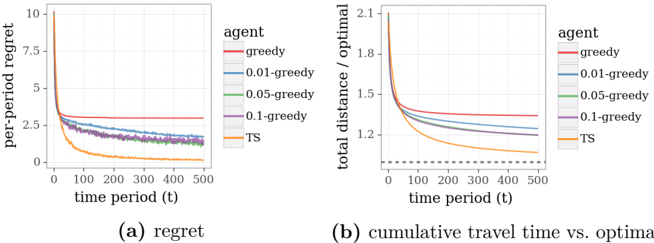
The image presents two line graphs comparing the performance of different agents in a decision-making task. Graph (a) shows the "per-period regret" over time, while graph (b) displays the "cumulative travel time vs. optimal" over time. Five different agents are compared: "greedy", "0.01-greedy", "0.05-greedy", "0.1-greedy", and "TS" (likely Thompson Sampling).
### Components/Axes
**Graph (a): Regret**
* **Title:** per-period regret
* **X-axis:** time period (t), ranging from 0 to 500
* **Y-axis:** per-period regret, ranging from 0 to 10
* **Agents (Legend, top-right of graph (a)):**
* Red: greedy
* Blue: 0.01-greedy
* Green: 0.05-greedy
* Purple: 0.1-greedy
* Orange: TS
**Graph (b): Cumulative Travel Time vs. Optimal**
* **Title:** total distance / optimal
* **X-axis:** time period (t), ranging from 0 to 500
* **Y-axis:** total distance / optimal, ranging from 1.2 to 2.1
* **Agents (Legend, top-right of graph (b)):**
* Red: greedy
* Blue: 0.01-greedy
* Green: 0.05-greedy
* Purple: 0.1-greedy
* Orange: TS
* A horizontal dashed grey line is present at y=1.0
### Detailed Analysis
**Graph (a): Regret**
* **Greedy (Red):** Starts at approximately 3 and remains relatively constant around 3.
* **0.01-greedy (Blue):** Starts around 5, decreases rapidly initially, then plateaus around 1.5 after t=200.
* **0.05-greedy (Green):** Starts around 7, decreases rapidly initially, then plateaus around 1.5 after t=200.
* **0.1-greedy (Purple):** Starts around 7, decreases rapidly initially, then plateaus around 1.5 after t=200.
* **TS (Orange):** Starts around 10, decreases rapidly, and plateaus near 0 after t=200.
**Graph (b): Cumulative Travel Time vs. Optimal**
* **Greedy (Red):** Starts at approximately 1.35 and remains relatively constant around 1.35.
* **0.01-greedy (Blue):** Starts around 1.6, decreases rapidly initially, then plateaus around 1.3 after t=200.
* **0.05-greedy (Green):** Starts around 1.8, decreases rapidly initially, then plateaus around 1.3 after t=200.
* **0.1-greedy (Purple):** Starts around 1.9, decreases rapidly initially, then plateaus around 1.25 after t=200.
* **TS (Orange):** Starts around 2.1, decreases rapidly, and approaches 1.1 after t=200.
### Key Observations
* The "TS" agent consistently outperforms the other agents in both metrics, achieving the lowest regret and cumulative travel time relative to the optimal.
* The "greedy" agent performs the worst, showing the highest regret and cumulative travel time.
* The epsilon-greedy agents (0.01, 0.05, 0.1) show similar performance, with higher epsilon values leading to slightly lower cumulative travel time.
* All agents except the greedy agent show a significant decrease in regret and cumulative travel time during the initial time periods, eventually plateauing.
### Interpretation
The graphs demonstrate the trade-offs between exploration and exploitation in decision-making. The "greedy" agent, which only exploits the current best option, performs poorly. The epsilon-greedy agents explore with a small probability, leading to better performance. The "TS" agent, which uses Thompson Sampling to balance exploration and exploitation, achieves the best performance. The data suggests that a well-balanced exploration strategy is crucial for minimizing regret and achieving near-optimal performance in this task. The fact that the TS agent's cumulative travel time approaches 1.1 suggests it is performing close to the theoretical optimum.