## Line Charts: Per-Period Regret and Cumulative Travel Time vs. Optimal
### Overview
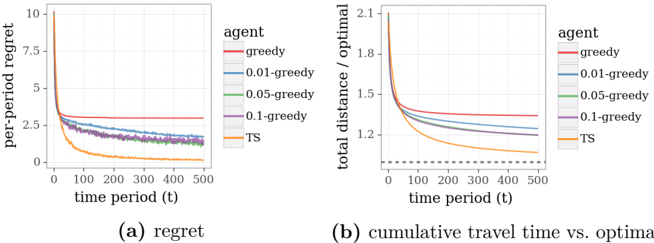
The image contains two line charts comparing the performance of different agent strategies over time. Chart (a) shows "per-period regret" decreasing with time, while chart (b) compares "total distance / optimal" against time. Both charts include a baseline "TS" strategy and four epsilon-greedy agents with varying exploration rates (0.01, 0.05, 0.1, and "greedy" for ε=1).
### Components/Axes
**Chart (a): Per-Period Regret**
- **X-axis**: Time period (t) from 0 to 500 (linear scale).
- **Y-axis**: Per-period regret (0 to 10, linear scale).
- **Legend**:
- Red: greedy (ε=1)
- Blue: 0.01-greedy (ε=0.01)
- Green: 0.05-greedy (ε=0.05)
- Purple: 0.1-greedy (ε=0.1)
- Orange: TS (Thompson Sampling baseline)
**Chart (b): Cumulative Travel Time vs. Optimal**
- **X-axis**: Time period (t) from 0 to 500 (linear scale).
- **Y-axis**: Total distance / optimal (0.5 to 2.1, linear scale; dashed line at 1.0 indicates optimal).
- **Legend**: Same as chart (a).
### Detailed Analysis
**Chart (a) Trends**:
1. All lines start near y=10 at t=0, then drop sharply within the first 100 time periods.
2. After t=100, lines plateau:
- TS (orange) stabilizes near y=0.1.
- 0.01-greedy (blue) stabilizes near y=0.5.
- 0.05-greedy (green) stabilizes near y=0.7.
- 0.1-greedy (purple) stabilizes near y=1.0.
- Greedy (red) stabilizes near y=2.5.
3. TS consistently has the lowest regret across all time periods.
**Chart (b) Trends**:
1. All lines start near y=2.1 at t=0, then decline rapidly within the first 100 time periods.
2. After t=100, lines approach the dashed optimal line (y=1.0):
- TS (orange) stabilizes near y=1.1.
- 0.01-greedy (blue) stabilizes near y=1.2.
- 0.05-greedy (green) stabilizes near y=1.3.
- 0.1-greedy (purple) stabilizes near y=1.5.
- Greedy (red) stabilizes near y=1.8.
3. TS maintains the closest proximity to the optimal line throughout.
### Key Observations
1. **TS Dominance**: The TS strategy outperforms all epsilon-greedy agents in both metrics, maintaining the lowest regret and closest approach to optimal performance.
2. **Greediness Trade-off**: Lower ε values (e.g., 0.01-greedy) outperform higher ε values (e.g., 0.1-greedy), suggesting reduced exploration improves long-term performance in this context.
3. **Rapid Convergence**: All strategies converge within the first 100 time periods, with minimal changes afterward.
4. **Optimal Gap**: Even the best epsilon-greedy agent (0.01-greedy) remains 20% worse than optimal in cumulative travel time.
### Interpretation
The data demonstrates that Thompson Sampling (TS) is the most effective strategy for minimizing regret and optimizing cumulative travel time. The epsilon-greedy agents show a clear inverse relationship between exploration (ε) and performance: lower ε (more greedy) agents achieve better results. This suggests that excessive exploration (high ε) introduces unnecessary suboptimal choices, while TS dynamically balances exploration and exploitation more effectively than fixed ε strategies. The rapid convergence implies that initial exploration phases are critical, but long-term performance is dominated by the agent's ability to exploit known optimal actions. These findings could inform hyperparameter tuning in reinforcement learning systems where exploration-exploitation trade-offs are critical.