## Chart/Diagram Type: Dual Axes Comparison Charts
### Overview
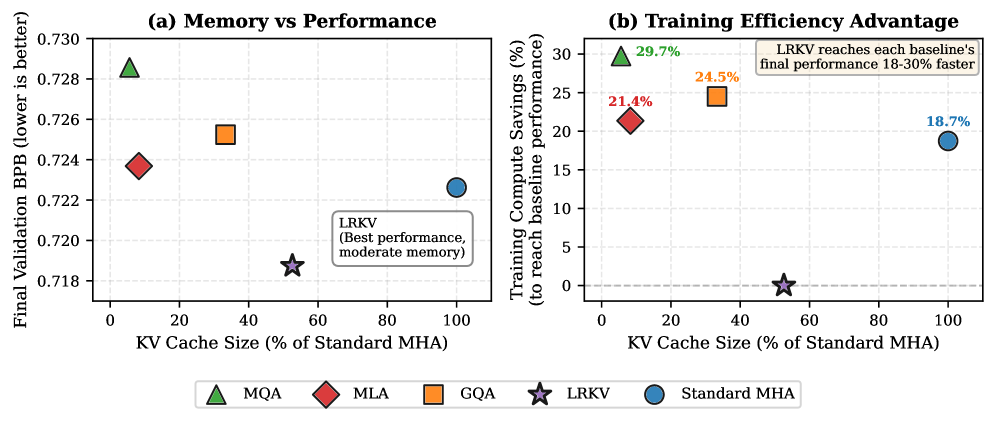
The image contains two side-by-side charts comparing memory usage, performance, and training efficiency of different key-value (KV) cache methods relative to a standard multi-head attention (MHA) baseline. The left chart (a) focuses on memory vs. validation performance, while the right chart (b) highlights training compute savings.
### Components/Axes
#### Chart (a): Memory vs Performance
- **X-axis**: KV Cache Size (% of Standard MHA)
- Scale: 0% to 100% in 20% increments
- **Y-axis**: Final Validation BPB (lower is better)
- Scale: 0.718 to 0.730 in 0.002 increments
- **Legend**:
- Green triangle: MHA
- Red diamond: MLA
- Orange square: GQA
- Purple star: LRKV
- Blue circle: Standard MHA
- **Embedded Text**:
- "LRKV (Best performance, moderate memory)"
#### Chart (b): Training Efficiency Advantage
- **X-axis**: KV Cache Size (% of Standard MHA)
- Scale: 0% to 100% in 20% increments
- **Y-axis**: Training Compute Savings (% to reach baseline performance)
- Scale: 0% to 30% in 5% increments
- **Legend**:
- Same symbols/colors as Chart (a)
- **Embedded Text**:
- "LRKV reaches each baseline's final performance 18-30% faster"
### Detailed Analysis
#### Chart (a) Data Points
1. **MHA** (Green triangle):
- X: 0% cache size
- Y: 0.728 BPB
2. **MLA** (Red diamond):
- X: 10% cache size
- Y: 0.724 BPB
3. **GQA** (Orange square):
- X: 30% cache size
- Y: 0.726 BPB
4. **LRKV** (Purple star):
- X: 50% cache size
- Y: 0.719 BPB
5. **Standard MHA** (Blue circle):
- X: 100% cache size
- Y: 0.723 BPB
#### Chart (b) Data Points
1. **MHA** (Green triangle):
- X: 0% cache size
- Y: 29.7% compute savings
2. **MLA** (Red diamond):
- X: 10% cache size
- Y: 21.4% compute savings
3. **GQA** (Orange square):
- X: 30% cache size
- Y: 24.5% compute savings
4. **LRKV** (Purple star):
- X: 50% cache size
- Y: 18.7% compute savings
5. **Standard MHA** (Blue circle):
- X: 100% cache size
- Y: Not explicitly labeled (implied baseline)
### Key Observations
1. **Memory vs Performance (Chart a)**:
- LRKV achieves the lowest BPB (0.719) at 50% cache size, outperforming all methods despite using moderate memory.
- Standard MHA (100% cache size) has higher BPB (0.723) than LRKV but lower than MHA (0.728).
- MHA (0% cache) has the highest BPB, indicating poor performance without cache optimization.
2. **Training Efficiency (Chart b)**:
- MHA requires the most compute savings (29.7%) to match baseline performance.
- LRKV achieves the lowest compute savings (18.7%) while still reaching baseline performance faster (18-30% speedup).
- GQA and MLA show intermediate efficiency (24.5% and 21.4%, respectively).
### Interpretation
- **LRKV Trade-offs**: LRKV demonstrates superior validation performance (lowest BPB) and training efficiency (fastest convergence) but uses moderate memory (50% cache size). This positions it as a balanced solution between memory and speed.
- **Standard MHA Limitations**: Despite using full cache size (100%), Standard MHA underperforms LRKV in both validation BPB and training efficiency, suggesting LRKV’s architectural improvements (e.g., caching strategy) are critical.
- **Memory-Performance Trade-off**: Increasing cache size generally reduces BPB (e.g., MHA at 0% → 0.728 BPB vs. Standard MHA at 100% → 0.723 BPB), but LRKV breaks this trend by achieving lower BPB at moderate cache size.
- **Compute Savings Paradox**: LRKV’s lower compute savings (18.7%) correlate with its faster convergence, implying architectural optimizations reduce redundant computations during training.
This analysis highlights LRKV as a Pareto-optimal method, balancing memory efficiency, validation performance, and training speed compared to baseline and alternative methods.