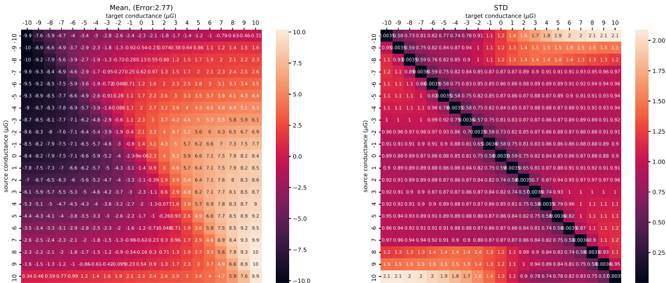
## Heatmap: Mean and Standard Deviation of Conductance
### Overview
The image presents two heatmaps side-by-side. The left heatmap displays the mean conductance values, while the right heatmap shows the standard deviation (STD) of conductance. Both heatmaps share the same axes, representing "source conductance" and "target conductance" in microSiemens (µG). The color intensity in each heatmap corresponds to the magnitude of the mean or STD value, as indicated by the color bars on the right side of each heatmap.
### Components/Axes
**Left Heatmap (Mean):**
* **Title:** Mean, (Error: 2.77)
* **X-axis:** target conductance (µG), ranging from -10 to 10 in integer increments.
* **Y-axis:** source conductance (µG), ranging from -10 to 10 in integer increments.
* **Color Bar:** Ranges from -10.0 (dark purple) to 10.0 (light yellow).
**Right Heatmap (STD):**
* **Title:** STD
* **X-axis:** target conductance (µG), ranging from -10 to 10 in integer increments.
* **Y-axis:** source conductance (µG), ranging from -10 to 10 in integer increments.
* **Color Bar:** Ranges from 0.0 (dark purple) to 2.00 (light yellow).
### Detailed Analysis
**Left Heatmap (Mean):**
The heatmap shows a clear diagonal trend. As both source and target conductance increase together, the mean conductance also increases.
* **Source Conductance -10 µG:**
* Target Conductance -10 µG: -9.3
* Target Conductance 0 µG: -3.4
* Target Conductance 10 µG: 0.79
* **Source Conductance 0 µG:**
* Target Conductance -10 µG: -3.3
* Target Conductance 0 µG: 0.4
* Target Conductance 10 µG: 7.1
* **Source Conductance 10 µG:**
* Target Conductance -10 µG: -0.34
* Target Conductance 0 µG: 1.4
* Target Conductance 10 µG: 9.0
**Right Heatmap (STD):**
The standard deviation is lowest along the diagonal where source and target conductance are equal. The STD increases as the difference between source and target conductance increases.
* **Source Conductance -10 µG:**
* Target Conductance -10 µG: 2.0
* Target Conductance 0 µG: 0.85
* Target Conductance 10 µG: 1.1
* **Source Conductance 0 µG:**
* Target Conductance -10 µG: 1.1
* Target Conductance 0 µG: 0.003
* Target Conductance 10 µG: 1.1
* **Source Conductance 10 µG:**
* Target Conductance -10 µG: 2.1
* Target Conductance 0 µG: 0.78
* Target Conductance 10 µG: 0.003
### Key Observations
* The mean conductance is strongly correlated with the target conductance when the source conductance is held constant.
* The standard deviation is minimized when the source and target conductances are equal.
* The error associated with the mean calculation is 2.77.
### Interpretation
The heatmaps illustrate the relationship between source and target conductance in terms of both the average value and the variability. The diagonal trend in the mean conductance heatmap suggests a linear relationship when the source and target conductances are similar. The STD heatmap indicates that the system is most stable (least variable) when the source and target conductances are closely matched. The increasing STD as the difference between source and target conductance grows implies that the system becomes less predictable or more sensitive to noise when these values diverge. The error value of 2.77 associated with the mean suggests a level of uncertainty in the mean conductance values.