## Heatmaps: Mean Error vs. Standard Deviation Across Conductance Ranges
### Overview
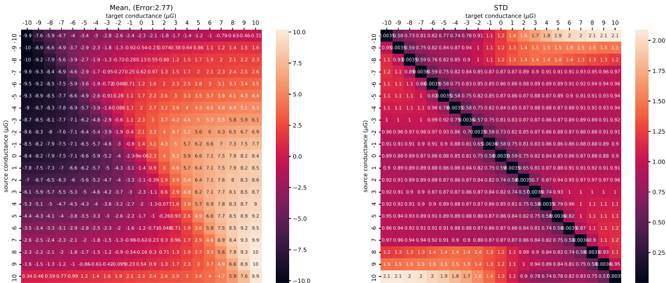
The image contains two side-by-side heatmaps comparing **mean error** (left) and **standard deviation (STD)** (right) across a grid of **source conductance (μG)** and **target conductance (μG)** values. Both heatmaps use a color gradient to represent numerical values, with axes ranging from -10 to 10 μG. The left heatmap emphasizes error magnitude, while the right highlights variability (STD).
---
### Components/Axes
#### Left Heatmap (Mean Error)
- **Title**: "Mean, (Error: 2.77)"
- **X-axis**: "target conductance (μG)" with values from -10 to 10 in increments of 1.
- **Y-axis**: "source conductance (μG)" with values from -10 to 10 in increments of 1.
- **Color Scale**: Red (negative values) to black (positive values), labeled from -10.0 to 10.0.
- **Legend**: Positioned on the right, with a vertical gradient matching the heatmap colors.
#### Right Heatmap (STD)
- **Title**: "STD"
- **X-axis**: "target conductance (μG)" (same scale as left).
- **Y-axis**: "source conductance (μG)" (same scale as left).
- **Color Scale**: Red (low values) to white (high values), labeled from 0.0 to 2.0.
- **Legend**: Positioned on the right, with a vertical gradient matching the heatmap colors.
---
### Detailed Analysis
#### Left Heatmap (Mean Error)
- **Key Values**:
- Top-left cell: **-9.9** (dark red).
- Bottom-right cell: **10.0** (black).
- Central region: Values cluster around **-2.0 to 2.0** (orange to red).
- Diagonal trend: Values increase from top-left (-9.9) to bottom-right (10.0).
- **Notable Patterns**:
- Negative values dominate the upper-left quadrant.
- Positive values dominate the lower-right quadrant.
- Sharp gradient near the center (e.g., **-2.77** at the center).
#### Right Heatmap (STD)
- **Key Values**:
- Top-left cell: **0.003** (dark red).
- Bottom-right cell: **2.0** (white).
- Central region: Values cluster around **0.8 to 1.5** (orange to light red).
- Diagonal trend: Values increase from top-left (0.003) to bottom-right (2.0).
- **Notable Patterns**:
- Lower variability (STD) in the upper-left quadrant.
- Higher variability in the lower-right quadrant.
- Consistent gradient across the grid.
---
### Key Observations
1. **Mean Error**:
- Errors are largest in magnitude at extreme conductance values (e.g., -10 μG source/target).
- The center of the grid shows moderate errors (~±2.77).
- A clear diagonal gradient suggests a relationship between source and target conductance affecting error.
2. **Standard Deviation**:
- Variability is lowest in the upper-left quadrant (STD < 0.1).
- Variability increases sharply toward the lower-right quadrant (STD up to 2.0).
- The diagonal trend mirrors the mean error heatmap, indicating correlated behavior.
3. **Color Consistency**:
- Both heatmaps align with their respective legends (e.g., -10 μG = dark red, 10 μG = black for mean error; 0.0 = dark red, 2.0 = white for STD).
---
### Interpretation
- **Mean Error Trends**:
- The model exhibits higher errors at extreme conductance values, suggesting potential instability or sensitivity in these regions.
- The central region (-2.77 mean error) may represent a "sweet spot" for balanced performance.
- **STD Trends**:
- Lower variability in low-conductance ranges implies more consistent predictions there.
- High variability in high-conductance ranges indicates instability, possibly due to data sparsity or model limitations.
- **Correlation**:
- The diagonal trends in both heatmaps suggest that source and target conductance interact nonlinearly, with errors and variability increasing as both values move toward extremes.
- **Practical Implications**:
- The model may require calibration or additional training data for high-conductance scenarios.
- The central region (-2.77 mean error) could be prioritized for applications requiring moderate conductance ranges.
---
### Spatial Grounding
- **Legends**: Positioned on the right of each heatmap, aligned vertically.
- **Axes**: Labeled on the left (y-axis) and bottom (x-axis) of each heatmap.
- **Color Bars**: Match the gradient of their respective heatmaps (left: red-black; right: red-white).
---
### Content Details
- **Mean Error Values**:
- Example cells:
- (-10, -10): -9.9
- (0, 0): -2.77
- (10, 10): 10.0
- **STD Values**:
- Example cells:
- (-10, -10): 0.003
- (0, 0): 0.8
- (10, 10): 2.0
---
### Final Notes
The heatmaps reveal a systematic relationship between conductance ranges and model performance, with errors and variability increasing at extremes. This suggests the need for targeted improvements in high-conductance scenarios.