\n
## Chart: MUSHRA Score Difference vs. Intended Angle
### Overview
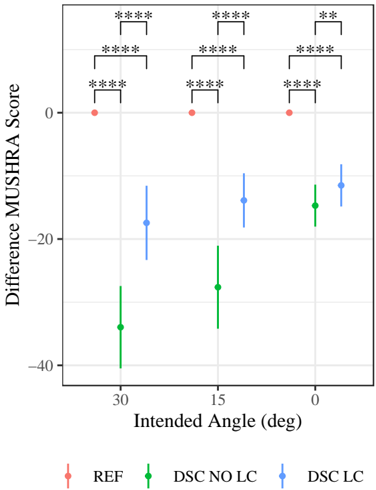
The image presents a chart displaying the difference in MUSHRA scores across different intended angles (30, 15, and 0 degrees) for three conditions: REF, DSC NO LC, and DSC LC. Error bars are present, and statistical significance is indicated by brackets with asterisks. The chart is a point plot with error bars representing the standard error or confidence interval.
### Components/Axes
* **X-axis:** "Intended Angle (deg)" with markers at 30, 15, and 0.
* **Y-axis:** "Difference MUSHRA Score" ranging from approximately -50 to 5.
* **Legend:** Located at the bottom-center of the chart.
* REF (Red): Represented by a salmon-colored point with error bar.
* DSC NO LC (Green): Represented by a green point with error bar.
* DSC LC (Blue): Represented by a blue point with error bar.
* **Statistical Significance Brackets:** Brackets with asterisks (****) are placed above the data points, indicating statistically significant differences between the conditions. The number of asterisks indicates the p-value.
### Detailed Analysis
The chart shows the difference in MUSHRA scores for each condition at each intended angle.
* **30 Degrees:**
* REF: Approximately +2.5, with an error bar extending from approximately 0 to 5.
* DSC NO LC: Approximately -35, with an error bar extending from approximately -40 to -30.
* DSC LC: Approximately -20, with an error bar extending from approximately -25 to -15.
* Statistical significance: REF vs DSC NO LC (****), REF vs DSC LC (****), DSC NO LC vs DSC LC (****).
* **15 Degrees:**
* REF: Approximately +1, with an error bar extending from approximately -2 to 4.
* DSC NO LC: Approximately -25, with an error bar extending from approximately -30 to -20.
* DSC LC: Approximately -15, with an error bar extending from approximately -20 to -10.
* Statistical significance: REF vs DSC NO LC (****), REF vs DSC LC (****), DSC NO LC vs DSC LC (****).
* **0 Degrees:**
* REF: Approximately +1, with an error bar extending from approximately -2 to 4.
* DSC NO LC: Approximately -20, with an error bar extending from approximately -25 to -15.
* DSC LC: Approximately -10, with an error bar extending from approximately -15 to -5.
* Statistical significance: REF vs DSC NO LC (****), REF vs DSC LC (*), DSC NO LC vs DSC LC (****).
The error bars are roughly the same length for each condition at each angle, suggesting similar variability.
### Key Observations
* The REF condition consistently shows a small positive difference in MUSHRA score across all angles.
* Both DSC NO LC and DSC LC conditions show negative differences in MUSHRA score, indicating a reduction in quality compared to the REF condition.
* DSC NO LC consistently has the lowest MUSHRA score difference, indicating the largest reduction in quality.
* The differences between REF and both DSC conditions are statistically significant at all angles.
* The difference between DSC NO LC and DSC LC is also statistically significant at all angles.
### Interpretation
The data suggests that both DSC NO LC and DSC LC processing methods result in a perceived reduction in quality compared to the REF condition, as measured by the MUSHRA score. DSC NO LC has a more substantial negative impact on perceived quality than DSC LC. The statistical significance of the differences indicates that these effects are not due to random chance.
The intended angle appears to have a minor effect on the magnitude of the difference, but the relative ranking of the conditions remains consistent across all angles. The consistent negative differences for DSC conditions suggest a systematic issue with these processing methods, potentially related to artifacts or distortions introduced during the processing. The brackets with asterisks indicate that the differences are statistically significant, meaning they are unlikely to have occurred by chance. The chart demonstrates the impact of different processing methods on perceived visual quality, highlighting the importance of careful processing to maintain high fidelity.