## Line Graphs: Eigenvalue Spectra of Head Similarity Matrices (128M)
### Overview
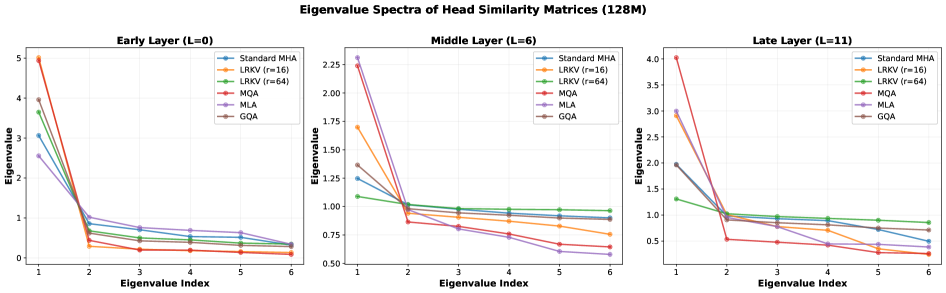
The image presents three line graphs comparing the eigenvalue spectra of head similarity matrices across three neural network layers: Early Layer (L=0), Middle Layer (L=6), and Late Layer (L=11). Each graph shows six methods (Standard MHA, LRKV (r=16), LRKV (r=64), MQA, MLA, GQA) with eigenvalues plotted against eigenvalue indices (1–6). The y-axis represents eigenvalue magnitude, while the x-axis represents the eigenvalue index.
---
### Components/Axes
- **X-axis**: "Eigenvalue Index" (1–6), labeled uniformly across all subplots.
- **Y-axis**: "Eigenvalue" (ranging from 0 to 5 in Early Layer, 0 to 2.5 in Middle Layer, and 0 to 4 in Late Layer).
- **Legend**: Located on the right side of each subplot, with six color-coded methods:
- **Blue**: Standard MHA
- **Orange**: LRKV (r=16)
- **Green**: LRKV (r=64)
- **Red**: MQA
- **Purple**: MLA
- **Brown**: GQA
- **Subplot Titles**:
- Top-left: "Early Layer (L=0)"
- Center: "Middle Layer (L=6)"
- Bottom-right: "Late Layer (L=11)"
---
### Detailed Analysis
#### Early Layer (L=0)
- **Standard MHA (Blue)**: Starts at ~5.0 (index 1), drops sharply to ~0.8 (index 2), then gradually declines to ~0.2 (index 6).
- **LRKV (r=16) (Orange)**: Begins at ~4.5 (index 1), declines to ~0.3 (index 2), then stabilizes near ~0.1 (index 6).
- **LRKV (r=64) (Green)**: Starts at ~3.8 (index 1), drops to ~0.5 (index 2), then remains flat (~0.3–0.4).
- **MQA (Red)**: Peaks at ~4.0 (index 1), drops to ~0.4 (index 2), then declines to ~0.1 (index 6).
- **MLA (Purple)**: Starts at ~2.5 (index 1), drops to ~0.6 (index 2), then stabilizes (~0.3–0.4).
- **GQA (Brown)**: Begins at ~3.0 (index 1), declines to ~0.7 (index 2), then remains flat (~0.4–0.5).
#### Middle Layer (L=6)
- **Standard MHA (Blue)**: Starts at ~2.5 (index 1), drops to ~1.0 (index 2), then declines to ~0.8 (index 6).
- **LRKV (r=16) (Orange)**: Begins at ~1.8 (index 1), drops to ~0.9 (index 2), then stabilizes (~0.7–0.8).
- **LRKV (r=64) (Green)**: Starts at ~1.2 (index 1), drops to ~0.9 (index 2), then remains flat (~0.8–0.9).
- **MQA (Red)**: Peaks at ~2.0 (index 1), drops to ~0.7 (index 2), then declines to ~0.5 (index 6).
- **MLA (Purple)**: Starts at ~2.2 (index 1), drops to ~0.8 (index 2), then stabilizes (~0.6–0.7).
- **GQA (Brown)**: Begins at ~1.5 (index 1), drops to ~0.9 (index 2), then remains flat (~0.7–0.8).
#### Late Layer (L=11)
- **Standard MHA (Blue)**: Starts at ~3.0 (index 1), drops to ~1.0 (index 2), then declines to ~0.5 (index 6).
- **LRKV (r=16) (Orange)**: Begins at ~2.8 (index 1), drops to ~0.9 (index 2), then stabilizes (~0.7–0.8).
- **LRKV (r=64) (Green)**: Starts at ~1.3 (index 1), drops to ~0.9 (index 2), then remains flat (~0.8–0.9).
- **MQA (Red)**: Peaks at ~3.5 (index 1), drops to ~0.6 (index 2), then declines to ~0.4 (index 6).
- **MLA (Purple)**: Starts at ~2.8 (index 1), drops to ~0.7 (index 2), then stabilizes (~0.5–0.6).
- **GQA (Brown)**: Begins at ~2.0 (index 1), drops to ~0.8 (index 2), then remains flat (~0.6–0.7).
---
### Key Observations
1. **Eigenvalue Decay**: All methods show a sharp decline in eigenvalues from index 1 to 2, followed by gradual stabilization. This suggests that the first two eigenvalues capture the majority of the variance in the similarity matrices.
2. **Method-Specific Trends**:
- **MLA (Purple)**: Consistently retains higher eigenvalues in early and middle layers compared to other methods, indicating stronger preservation of high-variance features.
- **LRKV (r=64) (Green)**: Shows the most stable eigenvalues across layers, suggesting robustness in capturing consistent patterns.
- **MQA (Red)**: Exhibits the steepest initial drop in all layers, implying a focus on early-layer features.
3. **Layer-Specific Patterns**:
- **Early Layer (L=0)**: Higher eigenvalues overall, reflecting greater importance of early-layer features.
- **Late Layer (L=11)**: Lower eigenvalues, indicating reduced significance of late-layer features in the similarity matrices.
---
### Interpretation
The eigenvalue spectra reveal how different attention mechanisms prioritize and retain information across layers.
- **MLA's performance** in early and middle layers suggests it effectively preserves critical features, potentially improving model interpretability or robustness.
- **LRKV (r=64)** demonstrates stability, which may indicate its suitability for tasks requiring consistent feature representation.
- The **sharp decay** in eigenvalues across all methods highlights the dominance of low-dimensional patterns in the similarity matrices, a common characteristic in attention mechanisms.
These trends could inform the design of more efficient or interpretable attention mechanisms by emphasizing methods that balance feature retention and computational efficiency.