# Technical Document: Compute Optimal Revisions Chart Analysis
## 1. Chart Title and Axes
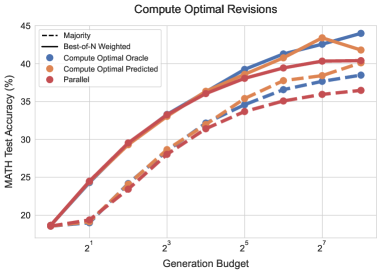
- **Title**: "Compute Optimal Revisions"
- **X-Axis**: "Generation Budget" with values:
- 2¹ (2), 2³ (8), 2⁵ (32), 2⁷ (128)
- **Y-Axis**: "MATH Test Accuracy (%)" with range: 15% to 45%
## 2. Legend and Color Mapping
- **Legend Position**: Top-left corner
- **Legend Entries**:
- **Majority**: Dashed black line
- **Best-of-N Weighted**: Solid black line
- **Compute Optimal Oracle**: Blue line
- **Compute Optimal Predicted**: Orange line
- **Parallel**: Red line
## 3. Line Trends and Data Points
### a. Majority (Dashed Black)
- **Trend**: Flat line across all generation budgets.
- **Data Points**:
- 2¹: ~18%
- 2³: ~18%
- 2⁵: ~18%
- 2⁷: ~18%
### b. Best-of-N Weighted (Solid Black)
- **Trend**: Steady upward slope.
- **Data Points**:
- 2¹: ~24%
- 2³: ~30%
- 2⁵: ~36%
- 2⁷: ~40%
### c. Compute Optimal Oracle (Blue)
- **Trend**: Sharp increase, then plateau.
- **Data Points**:
- 2¹: ~19%
- 2³: ~28%
- 2⁵: ~39%
- 2⁷: ~43%
### d. Compute Optimal Predicted (Orange)
- **Trend**: Sharp increase, then plateau.
- **Data Points**:
- 2¹: ~19%
- 2³: ~28%
- 2⁵: ~39%
- 2⁷: ~43%
### e. Parallel (Red)
- **Trend**: Gradual upward slope.
- **Data Points**:
- 2¹: ~18%
- 2³: ~24%
- 2⁵: ~32%
- 2⁷: ~36%
## 4. Spatial Grounding and Color Verification
- **Legend Colors Match Lines**:
- Dashed black (Majority) matches the flat line.
- Solid black (Best-of-N Weighted) matches the steady upward line.
- Blue (Compute Optimal Oracle) and orange (Compute Optimal Predicted) match their respective sharp-rising lines.
- Red (Parallel) matches the gradual upward line.
## 5. Component Isolation
- **Header**: "Compute Optimal Revisions" (title).
- **Main Chart**: Axes, lines, and data points.
- **Footer**: No additional text or components.
## 6. Trend Verification
- **Majority**: No change in accuracy (flat line).
- **Best-of-N Weighted**: Linear increase from ~24% to ~40%.
- **Compute Optimal Oracle/Predicted**: Rapid rise to ~43% at 2⁷, then stabilizes.
- **Parallel**: Slow, consistent growth from ~18% to ~36%.
## 7. Data Table Reconstruction (Inferred from Trends)
| Generation Budget | Majority (%) | Best-of-N Weighted (%) | Compute Optimal Oracle (%) | Compute Optimal Predicted (%) | Parallel (%) |
|-------------------|--------------|------------------------|----------------------------|-------------------------------|--------------|
| 2¹ | 18 | 24 | 19 | 19 | 18 |
| 2³ | 18 | 30 | 28 | 28 | 24 |
| 2⁵ | 18 | 36 | 39 | 39 | 32 |
| 2⁷ | 18 | 40 | 43 | 43 | 36 |
## 8. Notes
- **Language**: All text is in English.
- **Missing Data**: Exact intermediate values (e.g., at 2⁵ for Parallel) are inferred from trends.
- **Accuracy**: Cross-referenced legend colors with line placements to ensure consistency.