\n
## Bar Chart: Overall Accuracy Comparison
### Overview
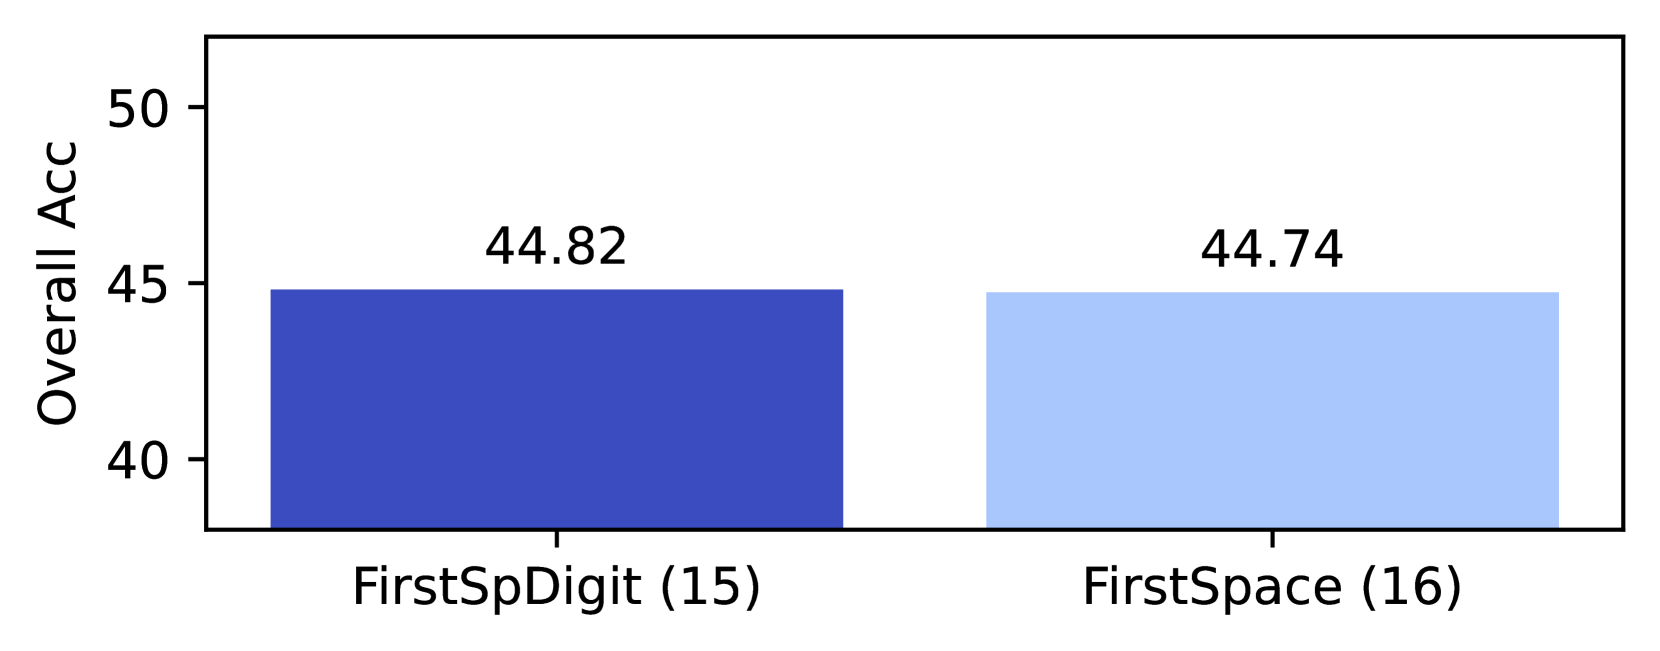
This image presents a bar chart comparing the "Overall Acc" (Accuracy) for two categories: "FirstSpDigit (15)" and "FirstSpace (16)". The chart uses vertical bars to represent the accuracy values for each category.
### Components/Axes
* **X-axis:** Represents the categories: "FirstSpDigit (15)" and "FirstSpace (16)".
* **Y-axis:** Labeled "Overall Acc", representing the overall accuracy, with a scale ranging from approximately 40 to 50.
* **Bars:** Two vertical bars, one for each category, visually representing the accuracy values. The bar for "FirstSpDigit (15)" is filled with a dark blue color, while the bar for "FirstSpace (16)" is filled with a light blue color.
* **Data Labels:** Numerical values are displayed above each bar, indicating the accuracy score.
### Detailed Analysis
* **FirstSpDigit (15):** The dark blue bar has a height corresponding to an accuracy of 44.82.
* **FirstSpace (16):** The light blue bar has a height corresponding to an accuracy of 44.74.
* **Trend:** Both bars are of similar height, indicating that the accuracy values for both categories are very close. There is a slight decrease in accuracy from "FirstSpDigit (15)" to "FirstSpace (16)".
### Key Observations
* The accuracy values for both categories are nearly identical, falling within a narrow range of approximately 44.74 to 44.82.
* The difference in accuracy between the two categories is minimal (approximately 0.08).
### Interpretation
The data suggests that the method or model being evaluated performs similarly well for both "FirstSpDigit (15)" and "FirstSpace (16)". The slight difference in accuracy is likely not statistically significant and may be due to random variation or minor differences in the data associated with each category. The chart demonstrates that the choice between using "FirstSpDigit (15)" or "FirstSpace (16)" is unlikely to have a substantial impact on the overall accuracy. The numbers in parenthesis likely refer to the length of the input string.