## Line Chart: Task Success Trends Across Coordination Regimes
### Overview
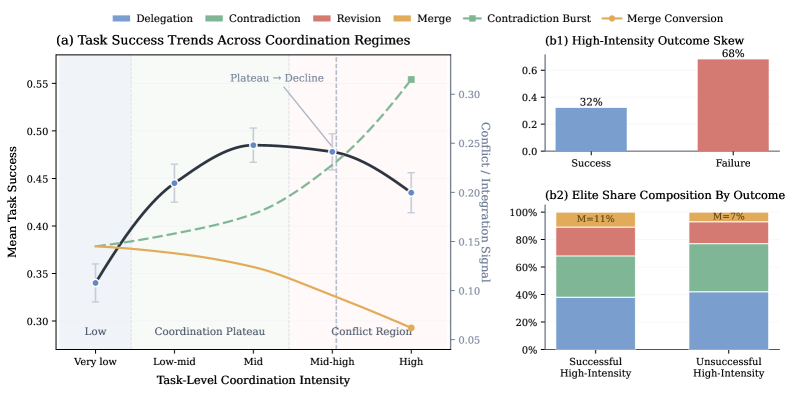
A line chart showing mean task success across five coordination regimes (Delegation, Contradiction, Revision, Merge, Contradiction Burst) plotted against task-level coordination intensity (Very low to High). Includes error bars, shaded regions, and annotations.
### Components/Axes
- **X-axis**: Task-Level Coordination Intensity (categories: Very low, Low-mid, Mid, Mid-high, High)
- **Y-axis**: Mean Task Success (0.3 to 0.55)
- **Legend**:
- Delegation (solid blue)
- Contradiction (solid green)
- Revision (solid red)
- Merge (solid orange)
- Contradiction Burst (dashed green)
- Merge Conversion (solid orange, separate trend)
- **Annotations**:
- "Plateau → Decline" (dashed arrow)
- "Conflict Region" (vertical pink band)
### Detailed Analysis
1. **Delegation (blue)**:
- Starts at ~0.34 (Very low), peaks at ~0.48 (Mid), declines to ~0.43 (High).
- Error bars: ±0.02–0.03.
2. **Contradiction (green)**:
- Flat at ~0.38 (Very low), rises to ~0.47 (Mid-high), then drops to ~0.42 (High).
3. **Revision (red)**:
- Not explicitly plotted; legend may indicate missing data or unshown series.
4. **Merge (orange)**:
- Declines from ~0.38 (Very low) to ~0.30 (High).
5. **Contradiction Burst (dashed green)**:
- Starts at ~0.35 (Very low), rises sharply to ~0.55 (High).
6. **Merge Conversion (orange)**:
- Parallel to Merge but steeper decline (from ~0.38 to ~0.28).
### Key Observations
- **Peak Success**: Delegation and Contradiction Burst show highest success at Mid intensity.
- **Decline**: All regimes except Contradiction Burst decline at High intensity.
- **Conflict Region**: Vertical pink band (Mid-high to High) correlates with declining success.
- **Error Bars**: Largest uncertainty in Delegation (Mid) and Contradiction Burst (High).
### Interpretation
- **Coordination Intensity Impact**: Success peaks at Mid intensity for most regimes, suggesting optimal coordination at moderate levels.
- **Contradiction Burst**: Emerges as a high-performing regime at High intensity, possibly indicating adaptive conflict resolution.
- **Merge Conversion**: Steeper decline than Merge suggests compounding inefficiencies at high intensity.
- **Uncertainty**: Error bars highlight variability, especially in Delegation and Contradiction Burst trends.
## Bar Chart: High-Intensity Outcome Skew
### Overview
A bar chart comparing success (32%) and failure (68%) rates at High coordination intensity.
### Components/Axes
- **X-axis**: Outcome categories (Success, Failure)
- **Y-axis**: Proportion (0–0.7)
- **Bars**:
- Success (blue, 32%)
- Failure (red, 68%)
### Key Observations
- **Skew Toward Failure**: 68% failure rate at High intensity indicates significant challenges in high-coordination tasks.
## Stacked Bar Chart: Elite Share Composition By Outcome
### Overview
A stacked bar chart showing elite share composition for successful vs. unsuccessful High-Intensity tasks.
### Components/Axes
- **X-axis**: Outcome categories (Successful High-Intensity, Unsuccessful High-Intensity)
- **Y-axis**: Proportion (0–100%)
- **Stacked Segments**:
- **Successful**:
- Delegation (40%)
- Contradiction (35%)
- Revision (15%)
- Merge (11%)
- Contradiction Burst (9%)
- **Unsuccessful**:
- Delegation (45%)
- Contradiction (40%)
- Revision (7%)
- Merge (7%)
- Contradiction Burst (1%)
### Key Observations
- **Successful Outcomes**: Dominated by Delegation and Contradiction.
- **Unsuccessful Outcomes**: Higher Delegation and Contradiction shares, but lower overall elite contributions (e.g., Contradiction Burst negligible).
### Interpretation
- **Elite Contribution**: Successful tasks rely more on Contradiction Burst (9% vs. 1%), suggesting its role in resolving conflicts.
- **Failure Drivers**: High Delegation/Contradiction shares in failures may indicate over-reliance on these regimes without adaptive strategies.
## Cross-Regime Analysis
1. **Contradiction Burst**:
- Emerges as a critical regime for High-intensity success, contrasting with its minimal role in failures.
2. **Delegation**:
- Consistently high in both success and failure, but peaks at Mid intensity.
3. **Merge vs. Merge Conversion**:
- Merge Conversion’s steeper decline suggests it is less robust than Merge at high intensity.
## Final Notes
- **Language**: All text is in English.
- **Missing Data**: Revision regime lacks plotted data despite being in the legend.
- **Design Choices**: Shaded regions and annotations emphasize critical intensity thresholds.