\n
## Diagram: Client Data Flow for Feature Similarity
### Overview
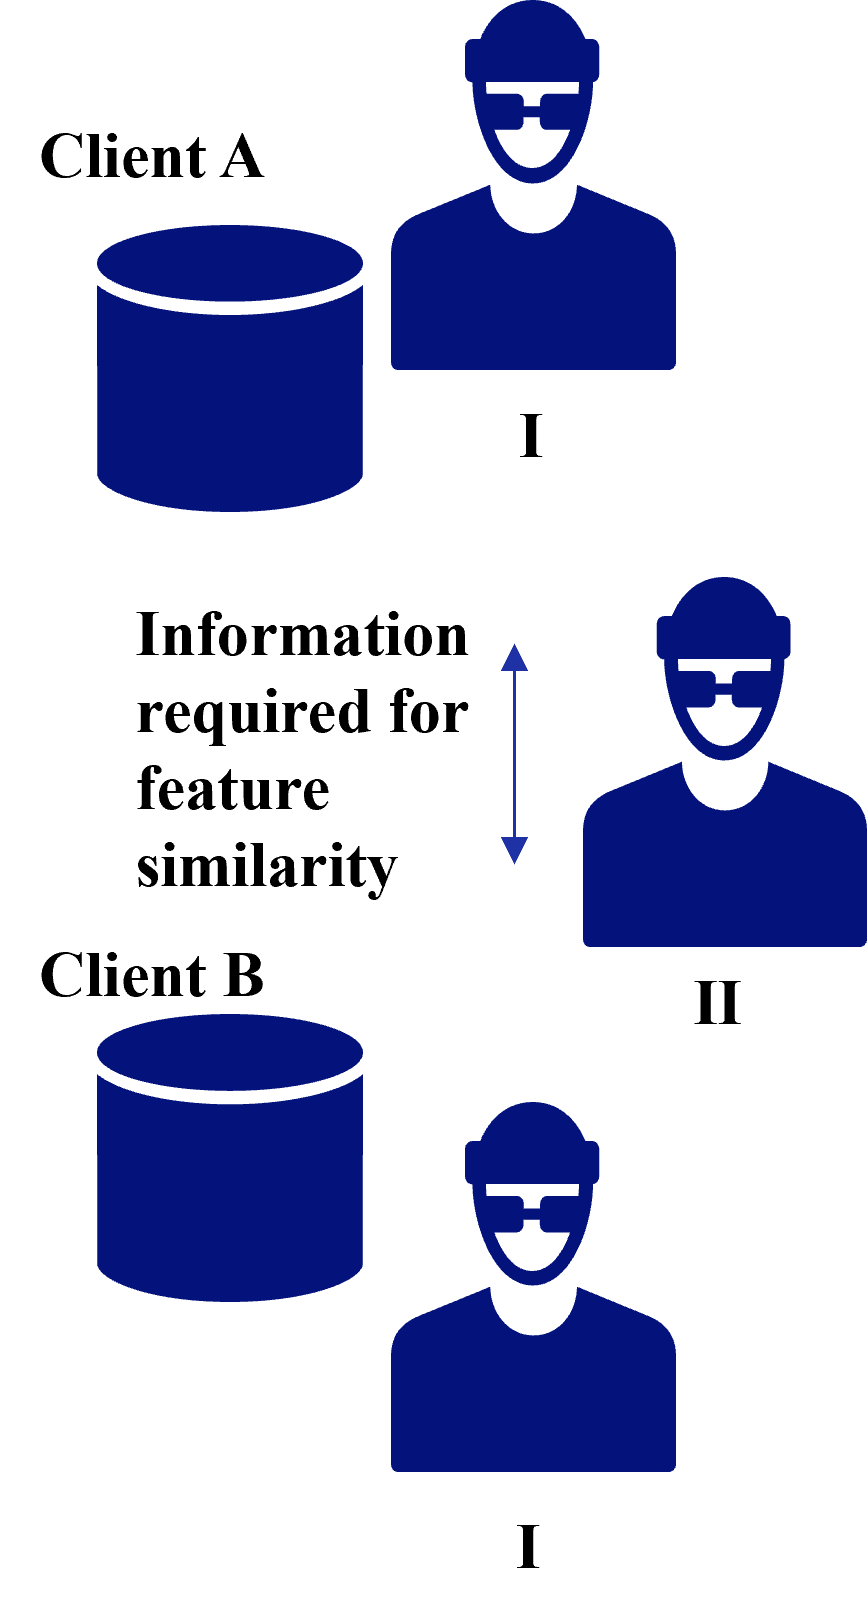
The image is a diagram illustrating a data flow between two clients (Client A and Client B) for the purpose of determining feature similarity. It depicts data being requested from Client A by an entity (II) and then potentially being used in conjunction with data from Client B (I). The diagram uses simple icons to represent clients, data stores, and individuals.
### Components/Axes
The diagram consists of the following components:
* **Client A:** Labeled "Client A" and represented by a cylinder (data store) and a silhouette of a person.
* **Client B:** Labeled "Client B" and represented by a cylinder (data store) and a silhouette of a person.
* **Entities I & II:** Represented by silhouettes of people wearing sunglasses.
* **Arrow:** A vertical arrow labeled "Information required for feature similarity" indicating the direction of data flow.
### Detailed Analysis or Content Details
The diagram shows the following relationships:
* Entity II requests information from Client A. The arrow points from Client A towards Entity II.
* Entity I is associated with Client B.
* The diagram suggests a process where information from Client A is needed to assess feature similarity, potentially in relation to data held by Client B.
* There are no numerical values or specific data points present in the diagram. It is a conceptual representation of a process.
### Key Observations
The diagram highlights a client-server or request-response relationship. The use of sunglasses on Entities I and II could imply anonymity or a third-party role. The diagram does not specify the nature of the "feature similarity" being assessed.
### Interpretation
The diagram illustrates a scenario where a third party (Entity II) requires data from Client A to perform a feature similarity analysis. This analysis likely involves comparing features from Client A's data with features from Client B's data, as indicated by the proximity of Entity I to Client B. The diagram suggests a data sharing or access request process. The sunglasses on the entities could indicate that the process is being conducted by an intermediary or that the identities of the entities are being obscured for privacy or security reasons. The diagram is a high-level conceptual overview and lacks specific details about the data being exchanged, the similarity metric used, or the purpose of the analysis. It is a visual representation of a data flow, not a quantitative analysis.