## Line Charts: Model Sparsity Efficiency Comparison
### Overview
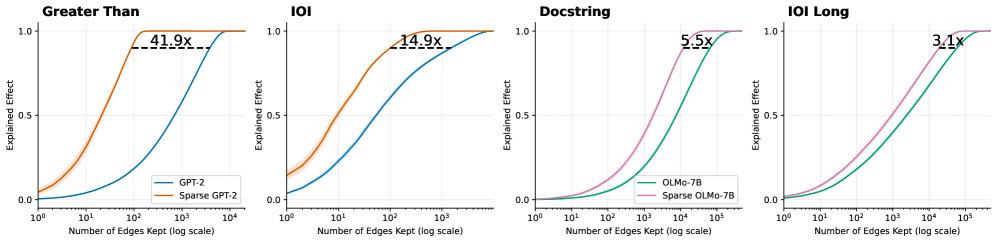
The image displays four separate line charts arranged horizontally, comparing the performance of standard versus sparse versions of two language models (GPT-2 and OLMo-7B) across four different tasks or benchmarks. Each chart plots "Explained Effect" against the "Number of Edges Kept" on a logarithmic scale, demonstrating how model performance (explained effect) improves as more edges (likely representing model parameters or connections) are retained. The sparse model variants consistently achieve higher explained effect with fewer edges.
### Components/Axes
* **Titles (Top of each chart, left to right):** "Greater Than", "IOI", "Docstring", "IOI Long".
* **Y-Axis (All charts):** Label: "Explained Effect". Scale: Linear, from 0.0 to 1.0, with major ticks at 0.0, 0.5, and 1.0.
* **X-Axis (All charts):** Label: "Number of Edges Kept (log scale)". Scale: Logarithmic.
* Charts 1 & 2 ("Greater Than", "IOI"): Range from 10⁰ to 10⁴.
* Charts 3 & 4 ("Docstring", "IOI Long"): Range from 10⁰ to 10⁵.
* **Legends:**
* Charts 1 & 2: Located in the bottom-right corner. Contains two entries: a blue line labeled "GPT-2" and an orange line labeled "Sparse GPT-2".
* Charts 3 & 4: Located in the bottom-right corner. Contains two entries: a green line labeled "OLMo-7B" and a pink line labeled "Sparse OLMo-7B".
* **Annotations:** Each chart contains a horizontal dashed black line near the top, connecting the plateau points of the two curves. Above this line is a text annotation indicating a multiplier (e.g., "41.9x").
### Detailed Analysis
**Chart 1: Greater Than**
* **Trend Verification:** The blue line (GPT-2) shows a gradual, sigmoidal increase from near 0.0 at 10⁰ edges to 1.0 at approximately 10⁴ edges. The orange line (Sparse GPT-2) rises much more steeply, reaching 1.0 at just above 10² edges.
* **Data Points & Annotation:** The dashed line and annotation "41.9x" indicate that the Sparse GPT-2 model achieves the same maximum explained effect (1.0) using approximately 41.9 times fewer edges than the standard GPT-2 model.
**Chart 2: IOI**
* **Trend Verification:** Similar pattern to Chart 1. The blue line (GPT-2) increases gradually. The orange line (Sparse GPT-2) increases more rapidly.
* **Data Points & Annotation:** The annotation "14.9x" signifies that Sparse GPT-2 reaches peak performance with about 14.9 times fewer edges than GPT-2 on the IOI task.
**Chart 3: Docstring**
* **Trend Verification:** The green line (OLMo-7B) shows a steady increase. The pink line (Sparse OLMo-7B) has a steeper slope, indicating faster performance gain per edge added.
* **Data Points & Annotation:** The annotation "5.5x" shows Sparse OLMo-7B is 5.5 times more edge-efficient than standard OLMo-7B for the Docstring task.
**Chart 4: IOI Long**
* **Trend Verification:** The green line (OLMo-7B) and pink line (Sparse OLMo-7B) follow similar trajectories to Chart 3, with the sparse variant maintaining a lead.
* **Data Points & Annotation:** The annotation "3.1x" indicates a 3.1x edge efficiency advantage for Sparse OLMo-7B over OLMo-7B on the IOI Long task.
### Key Observations
1. **Consistent Superiority of Sparse Models:** In all four tasks, the sparse model variant (orange or pink line) achieves a higher "Explained Effect" at any given number of edges compared to its standard counterpart (blue or green line).
2. **Varying Efficiency Gains:** The magnitude of the efficiency gain (the multiplier) varies significantly by task and model. It is highest for GPT-2 on the "Greater Than" task (41.9x) and lowest for OLMo-7B on the "IOI Long" task (3.1x).
3. **Task/Model Dependency:** The efficiency gap appears larger for the GPT-2 model pair (Charts 1 & 2) than for the OLMo-7B pair (Charts 3 & 4) across the presented tasks.
4. **Performance Ceiling:** All models eventually reach an Explained Effect of 1.0, but the sparse models reach this ceiling at a much lower edge count.
### Interpretation
These charts provide a Peircean investigation into the efficiency of model sparsification techniques. The "Explained Effect" likely measures how well a simplified (sparse) model can replicate the behavior or performance of a full model. The data demonstrates a clear and significant finding: **pruning a model to keep only a subset of its edges (sparsification) does not merely maintain performance but does so with dramatically greater parameter efficiency.**
The relationship shown is a classic efficiency frontier: sparse models dominate the standard models on a plot of performance vs. resource (edges) usage. The varying multipliers (41.9x, 14.9x, etc.) suggest that the benefit of sparsification is not uniform. It is highly dependent on both the base model architecture (GPT-2 vs. OLMo-7B) and the specific cognitive task being evaluated (e.g., "Greater Than" vs. "IOI Long"). This implies that some tasks or model structures are more amenable to compression than others. The anomaly to note is the significant drop in the efficiency multiplier for the OLMo-7B model on the "IOI Long" task compared to its performance on "Docstring," suggesting the long-context IOI task may rely on distributed knowledge that is harder to sparsify effectively. Overall, the visual evidence strongly advocates for the use of sparse models as a means to achieve high performance with a fraction of the computational footprint.