## Heatmap: Classification Accuracies
### Overview
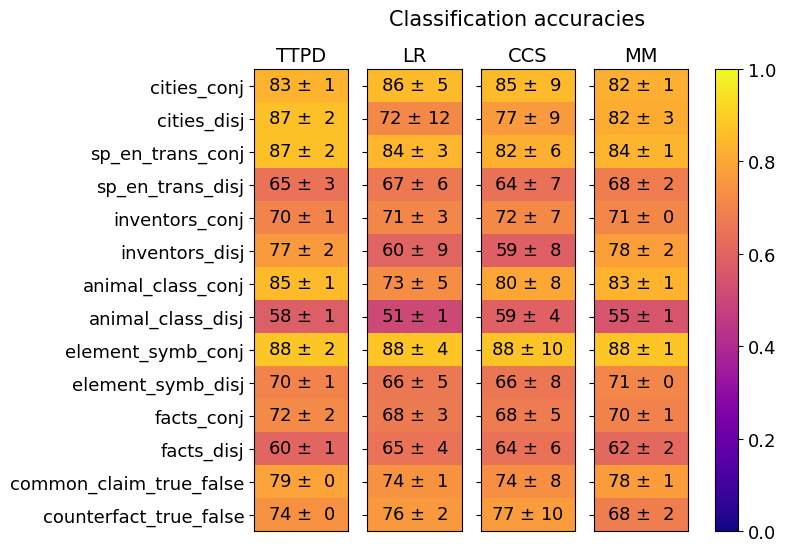
The image is a heatmap visualizing classification accuracies across different methods (TTPD, LR, CCS, MM) and linguistic categories (e.g., cities, inventors, animal classes). Values are represented by color intensity (purple = low, yellow = high) and annotated with numerical accuracies and standard deviations.
### Components/Axes
- **Y-axis (Categories)**:
- cities_conj, cities_disj
- sp_en_trans_conj, sp_en_trans_disj
- inventors_conj, inventors_disj
- animal_class_conj, animal_class_disj
- element_symb_conj, element_symb_disj
- facts_conj, facts_disj
- common_claim_true_false, counterfact_true_false
- **X-axis (Methods)**: TTPD, LR, CCS, MM
- **Legend**: Color scale from 0.0 (purple) to 1.0 (yellow), with intermediate values (0.2, 0.4, 0.6, 0.8).
- **Title**: "Classification accuracies" (top center).
### Detailed Analysis
#### Y-axis Categories and Method Performance
1. **cities_conj**:
- TTPD: 83 ± 1 (light yellow)
- LR: 86 ± 5 (yellow)
- CCS: 85 ± 9 (yellow)
- MM: 82 ± 1 (yellow)
2. **cities_disj**:
- TTPD: 87 ± 2 (yellow)
- LR: 72 ± 12 (orange)
- CCS: 77 ± 9 (orange)
- MM: 82 ± 3 (yellow)
3. **sp_en_trans_conj**:
- TTPD: 87 ± 2 (yellow)
- LR: 84 ± 3 (yellow)
- CCS: 82 ± 6 (orange)
- MM: 84 ± 1 (yellow)
4. **sp_en_trans_disj**:
- TTPD: 65 ± 3 (orange)
- LR: 67 ± 6 (orange)
- CCS: 64 ± 7 (orange)
- MM: 68 ± 2 (orange)
5. **inventors_conj**:
- TTPD: 70 ± 1 (orange)
- LR: 71 ± 3 (orange)
- CCS: 72 ± 7 (orange)
- MM: 71 ± 0 (orange)
6. **inventors_disj**:
- TTPD: 77 ± 2 (orange)
- LR: 60 ± 9 (red)
- CCS: 59 ± 8 (red)
- MM: 78 ± 2 (orange)
7. **animal_class_conj**:
- TTPD: 85 ± 1 (yellow)
- LR: 73 ± 5 (orange)
- CCS: 80 ± 8 (orange)
- MM: 83 ± 1 (yellow)
8. **animal_class_disj**:
- TTPD: 58 ± 1 (red)
- LR: 51 ± 1 (red)
- CCS: 59 ± 4 (red)
- MM: 55 ± 1 (red)
9. **element_symb_conj**:
- TTPD: 88 ± 2 (yellow)
- LR: 88 ± 4 (yellow)
- CCS: 88 ± 10 (yellow)
- MM: 88 ± 1 (yellow)
10. **element_symb_disj**:
- TTPD: 70 ± 1 (orange)
- LR: 66 ± 5 (orange)
- CCS: 66 ± 8 (orange)
- MM: 71 ± 0 (orange)
11. **facts_conj**:
- TTPD: 72 ± 2 (orange)
- LR: 68 ± 3 (orange)
- CCS: 68 ± 5 (orange)
- MM: 70 ± 1 (orange)
12. **facts_disj**:
- TTPD: 60 ± 1 (red)
- LR: 65 ± 4 (orange)
- CCS: 64 ± 6 (orange)
- MM: 62 ± 2 (orange)
13. **common_claim_true_false**:
- TTPD: 79 ± 0 (orange)
- LR: 74 ± 1 (orange)
- CCS: 74 ± 8 (orange)
- MM: 78 ± 1 (orange)
14. **counterfact_true_false**:
- TTPD: 74 ± 0 (orange)
- LR: 76 ± 2 (orange)
- CCS: 77 ± 10 (orange)
- MM: 68 ± 2 (orange)
### Key Observations
- **Highest accuracies**:
- Conjunction tasks (e.g., `element_symb_conj`) consistently achieve near-perfect scores (88 ± 1–10) across all methods.
- TTPD and MM outperform others in disjunction tasks (e.g., `cities_disj`, `inventors_disj`).
- **Lowest accuracies**:
- Disjunction tasks (e.g., `animal_class_disj`) show poor performance (51–59%) across all methods.
- `inventors_disj` and `animal_class_disj` have the highest variability (large standard deviations).
- **Method trends**:
- TTPD and MM generally outperform LR and CCS in conjunction tasks.
- LR struggles with disjunction tasks (e.g., `cities_disj`: 72 ± 12).
### Interpretation
The data suggests that **conjunction tasks** (e.g., `element_symb_conj`) are easier to classify than disjunction tasks (e.g., `animal_class_disj`), likely due to simpler syntactic structures. Methods like **TTPD** and **MM** demonstrate robustness across both task types, while **LR** and **CCS** underperform in disjunction scenarios. The high variability in disjunction tasks (e.g., `inventors_disj`: 60 ± 9) indicates potential challenges in handling negated or complex logical structures. The near-perfect performance on conjunction tasks implies these methods are well-suited for straightforward syntactic relationships but may lack generalization to more nuanced linguistic patterns.