## Heatmap: Classification Accuracies
### Overview
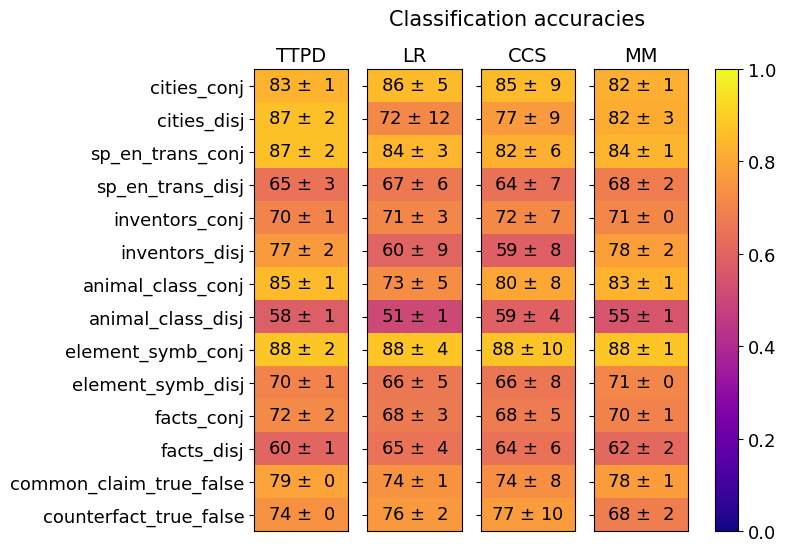
The image is a heatmap displaying classification accuracies for different models (TTPD, LR, CCS, MM) across various categories (cities_conj, cities_disj, etc.). The color intensity represents the accuracy score, ranging from dark blue (low accuracy) to bright yellow (high accuracy). Each cell contains the accuracy score with its associated uncertainty.
### Components/Axes
* **Title:** Classification accuracies
* **Columns (Models):** TTPD, LR, CCS, MM
* **Rows (Categories):** cities\_conj, cities\_disj, sp\_en\_trans\_conj, sp\_en\_trans\_disj, inventors\_conj, inventors\_disj, animal\_class\_conj, animal\_class\_disj, element\_symb\_conj, element\_symb\_disj, facts\_conj, facts\_disj, common\_claim\_true\_false, counterfact\_true\_false
* **Colorbar:** Ranges from 0.0 (dark blue) to 1.0 (bright yellow), representing the classification accuracy score.
### Detailed Analysis or ### Content Details
Here's a breakdown of the accuracy scores for each model and category:
* **TTPD:**
* cities\_conj: 83 ± 1
* cities\_disj: 87 ± 2
* sp\_en\_trans\_conj: 87 ± 2
* sp\_en\_trans\_disj: 65 ± 3
* inventors\_conj: 70 ± 1
* inventors\_disj: 77 ± 2
* animal\_class\_conj: 85 ± 1
* animal\_class\_disj: 58 ± 1
* element\_symb\_conj: 88 ± 2
* element\_symb\_disj: 70 ± 1
* facts\_conj: 72 ± 2
* facts\_disj: 60 ± 1
* common\_claim\_true\_false: 79 ± 0
* counterfact\_true\_false: 74 ± 0
* **LR:**
* cities\_conj: 86 ± 5
* cities\_disj: 72 ± 12
* sp\_en\_trans\_conj: 84 ± 3
* sp\_en\_trans\_disj: 67 ± 6
* inventors\_conj: 71 ± 3
* inventors\_disj: 60 ± 9
* animal\_class\_conj: 73 ± 5
* animal\_class\_disj: 51 ± 1
* element\_symb\_conj: 88 ± 4
* element\_symb\_disj: 66 ± 5
* facts\_conj: 68 ± 3
* facts\_disj: 65 ± 4
* common\_claim\_true\_false: 74 ± 1
* counterfact\_true\_false: 76 ± 2
* **CCS:**
* cities\_conj: 85 ± 9
* cities\_disj: 77 ± 9
* sp\_en\_trans\_conj: 82 ± 6
* sp\_en\_trans\_disj: 64 ± 7
* inventors\_conj: 72 ± 7
* inventors\_disj: 59 ± 8
* animal\_class\_conj: 80 ± 8
* animal\_class\_disj: 59 ± 4
* element\_symb\_conj: 88 ± 10
* element\_symb\_disj: 66 ± 8
* facts\_conj: 68 ± 5
* facts\_disj: 64 ± 6
* common\_claim\_true\_false: 74 ± 8
* counterfact\_true\_false: 77 ± 10
* **MM:**
* cities\_conj: 82 ± 1
* cities\_disj: 82 ± 3
* sp\_en\_trans\_conj: 84 ± 1
* sp\_en\_trans\_disj: 68 ± 2
* inventors\_conj: 71 ± 0
* inventors\_disj: 78 ± 2
* animal\_class\_conj: 83 ± 1
* animal\_class\_disj: 55 ± 1
* element\_symb\_conj: 88 ± 1
* element\_symb\_disj: 71 ± 0
* facts\_conj: 70 ± 1
* facts\_disj: 62 ± 2
* common\_claim\_true\_false: 78 ± 1
* counterfact\_true\_false: 68 ± 2
### Key Observations
* **High Accuracy:** The "element\_symb\_conj" category consistently shows high accuracy (around 88) across all models.
* **Low Accuracy:** The "animal\_class\_disj" category consistently shows lower accuracy across all models, ranging from 51 to 59.
* **Model Performance:** TTPD generally shows high accuracy across most categories. LR and CCS have more variability in their performance. MM is generally consistent, but sometimes lower than TTPD.
* **Uncertainty:** The uncertainty values vary across models and categories, with LR and CCS often having higher uncertainty (larger standard deviation) compared to TTPD and MM.
### Interpretation
The heatmap provides a visual comparison of the classification accuracies of four different models across a range of categories. The color gradient allows for quick identification of high-performing and low-performing areas.
The data suggests that:
* Some categories are inherently easier to classify than others (e.g., "element\_symb\_conj" vs. "animal\_class\_disj").
* The TTPD model generally performs well across all categories.
* The LR and CCS models have more variable performance, suggesting they might be more sensitive to the specific characteristics of each category.
* The MM model provides a consistent level of accuracy, although it may not reach the highest levels achieved by TTPD in some categories.
The uncertainty values indicate the variability in the model's performance. Higher uncertainty suggests that the model's accuracy can fluctuate more depending on the specific data it is trained on.