## Line Chart: Validation Loss Difference vs Tokens Trained
### Overview
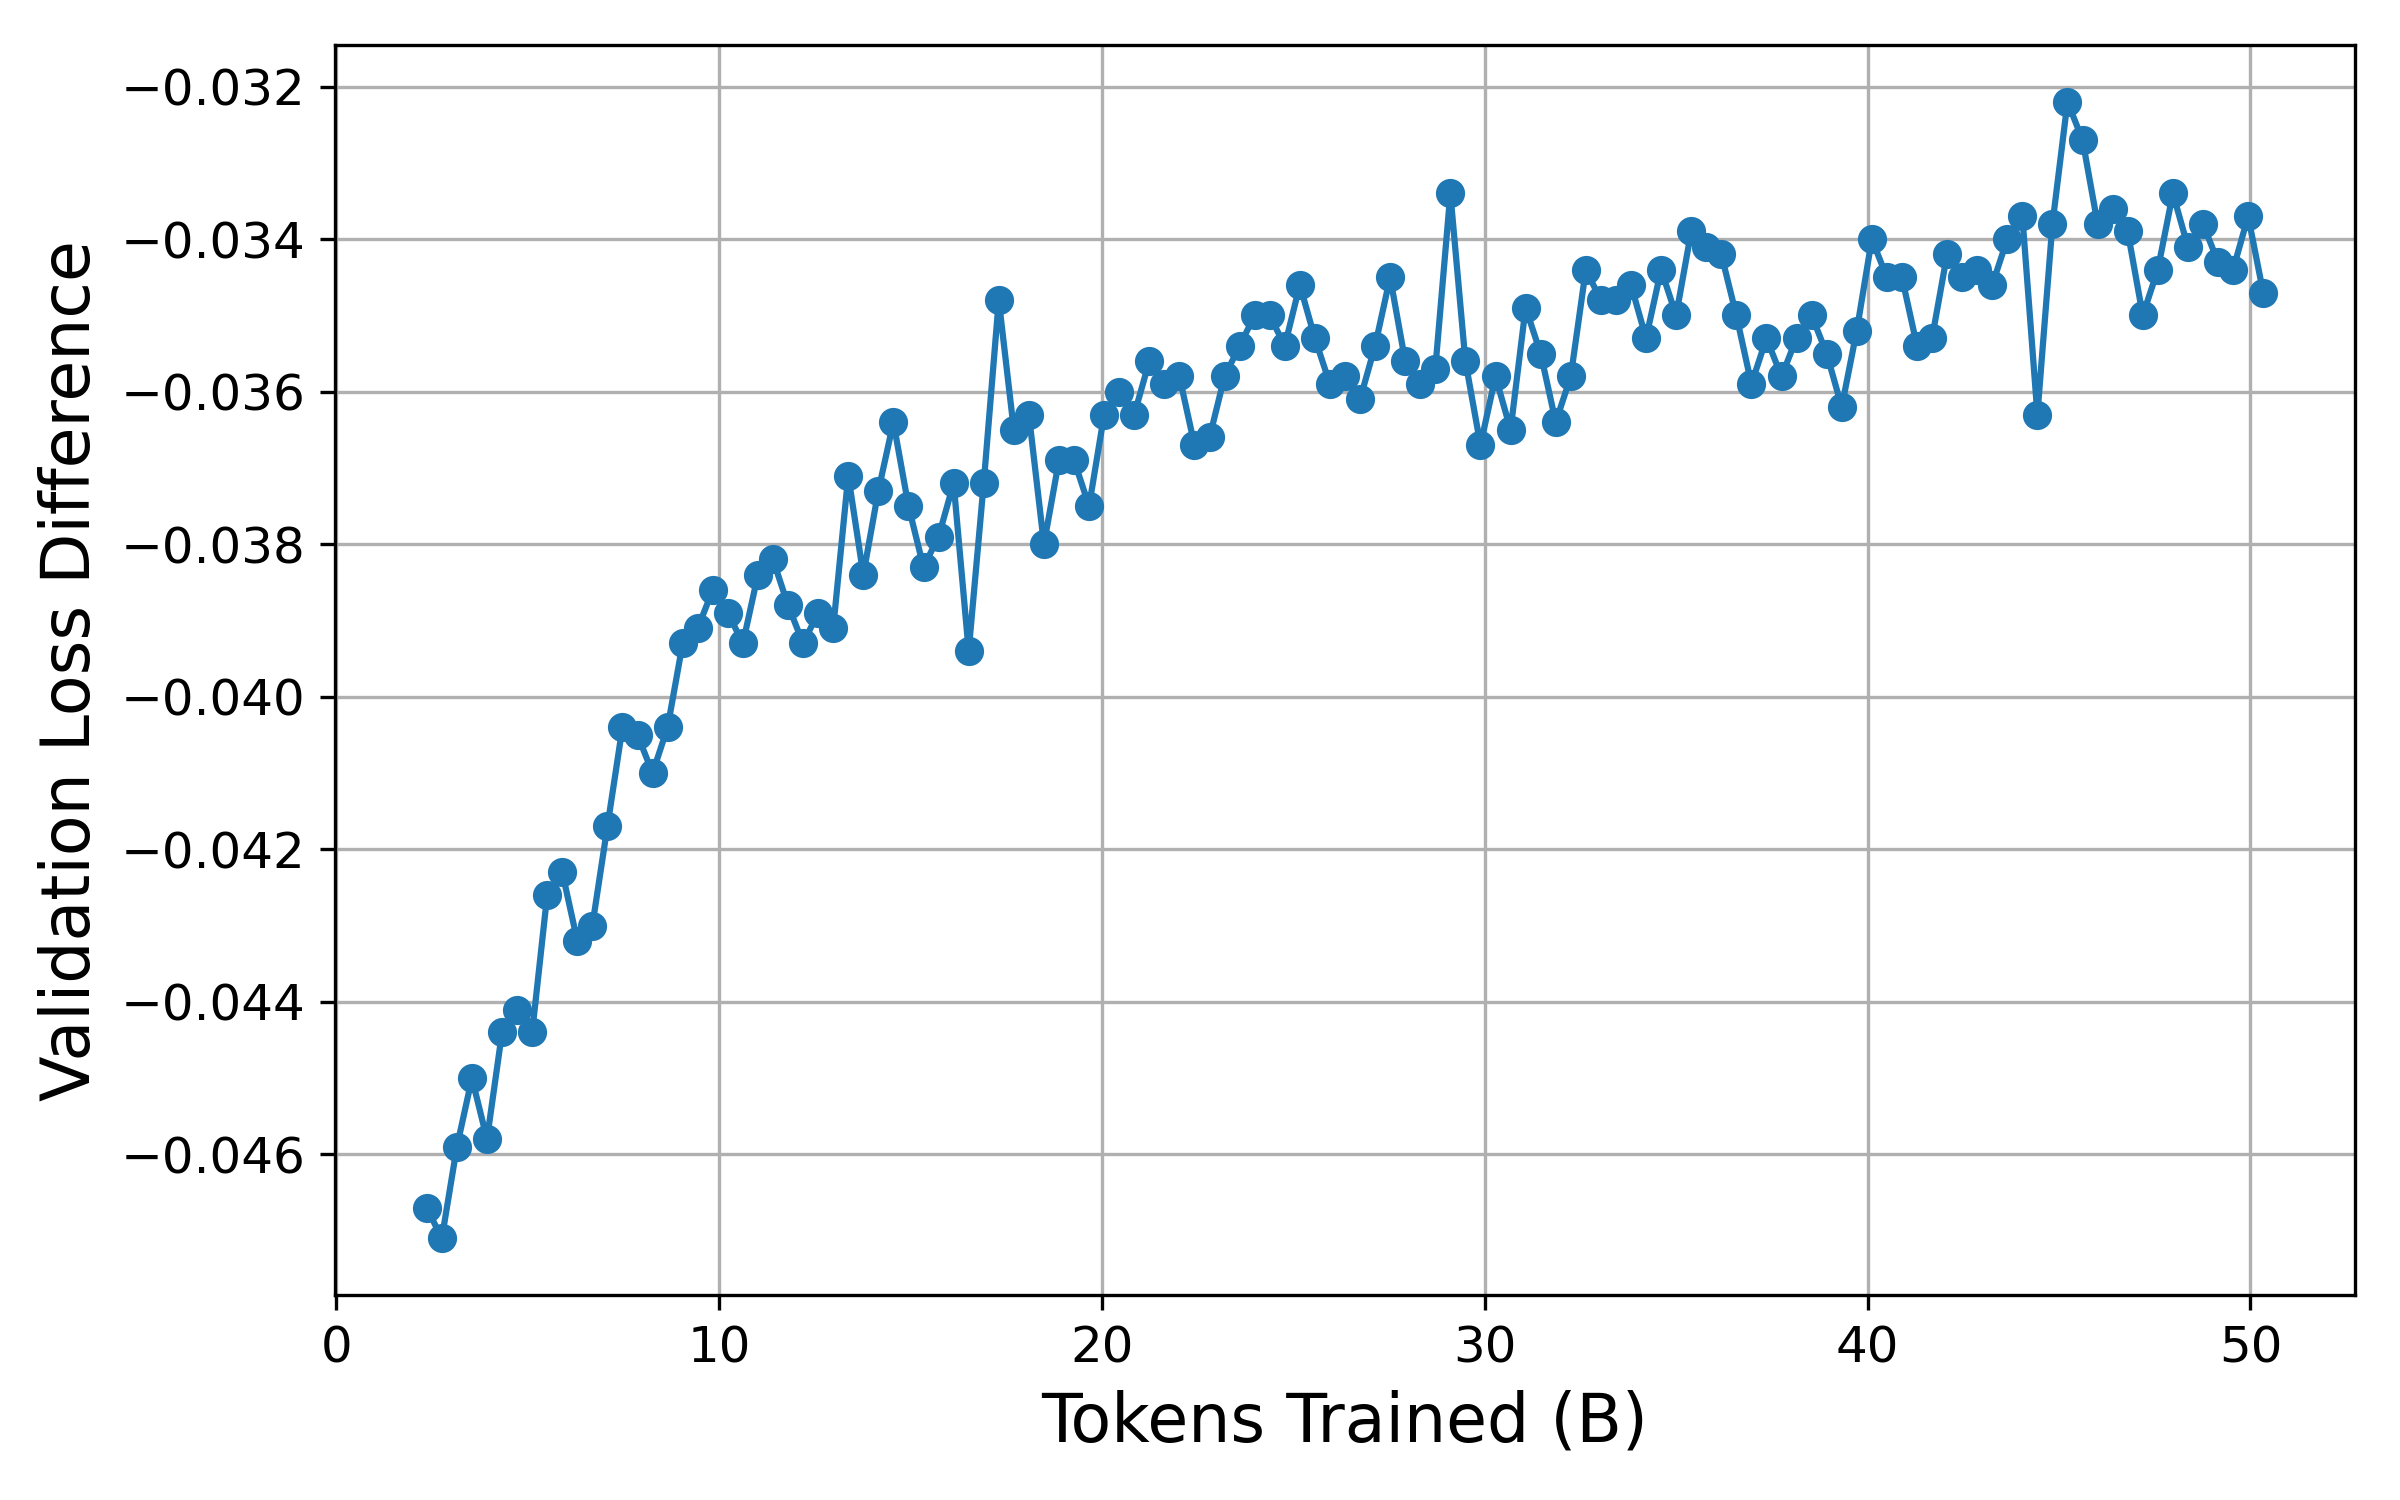
The chart illustrates the relationship between the number of tokens trained (in billions) and the validation loss difference over time. The y-axis represents the validation loss difference (negative values indicate improvement), while the x-axis tracks training progress in billions of tokens. The data shows a general trend of improvement with increasing training data, though with notable fluctuations.
### Components/Axes
- **X-axis (Horizontal)**: "Tokens Trained (B)" with markers at 0, 10, 20, 30, 40, and 50 billion tokens.
- **Y-axis (Vertical)**: "Validation Loss Difference" ranging from -0.046 to -0.032 in increments of 0.002.
- **Legend**: Located in the top-right corner, indicating a single data series represented by blue circular markers connected by a line.
- **Data Points**: Blue dots with error bars (not explicitly labeled but visually present).
### Detailed Analysis
- **Initial Phase (0–10B tokens)**:
- Validation loss difference starts at approximately **-0.046** at 0 tokens.
- Rapid improvement occurs, reaching **-0.042** by 5B tokens.
- Slight plateau observed between 5–7B tokens (~ -0.043 to -0.042).
- **Mid-Phase (10–30B tokens)**:
- Continued improvement to **-0.038** by 15B tokens.
- Notable volatility between 15–20B tokens, with a local minimum of **-0.039** at 18B tokens.
- Sharp improvement to **-0.036** by 25B tokens, followed by stabilization around **-0.035** to **-0.037**.
- **Late Phase (30–50B tokens)**:
- Gradual improvement to **-0.034** by 40B tokens.
- Increased volatility observed after 40B tokens, with a peak of **-0.032** at 45B tokens.
- Final value at 50B tokens: **-0.035**.
### Key Observations
1. **Overall Trend**: Validation loss difference improves (becomes less negative) as tokens trained increase, suggesting better model generalization.
2. **Volatility**: Significant fluctuations occur in the 15–20B and 40–50B token ranges, potentially indicating overfitting, data complexity, or training instability.
3. **Inflection Points**:
- Steepest improvement between 5–10B tokens.
- Local minimum at 18B tokens (-0.039).
- Peak improvement at 45B tokens (-0.032).
### Interpretation
The data demonstrates that increasing training data generally enhances model performance, as evidenced by the negative validation loss difference trending toward zero. However, the volatility in later stages suggests potential challenges:
- **Overfitting**: Sharp improvements followed by reversals may indicate the model is memorizing noise in the training data.
- **Data Complexity**: Fluctuations in the 40–50B range could reflect difficulties in generalizing to edge cases or domain shifts.
- **Training Dynamics**: The mid-phase plateau (15–20B tokens) might correspond to architectural bottlenecks or optimization challenges.
The chart underscores the importance of balancing dataset size with regularization techniques to maintain stable generalization. The final validation loss difference of -0.035 at 50B tokens suggests moderate improvement but leaves room for optimization through hyperparameter tuning or architectural adjustments.