## Grouped Bar Chart: Model Performance Comparison Across Spatial Reasoning Tasks
### Overview
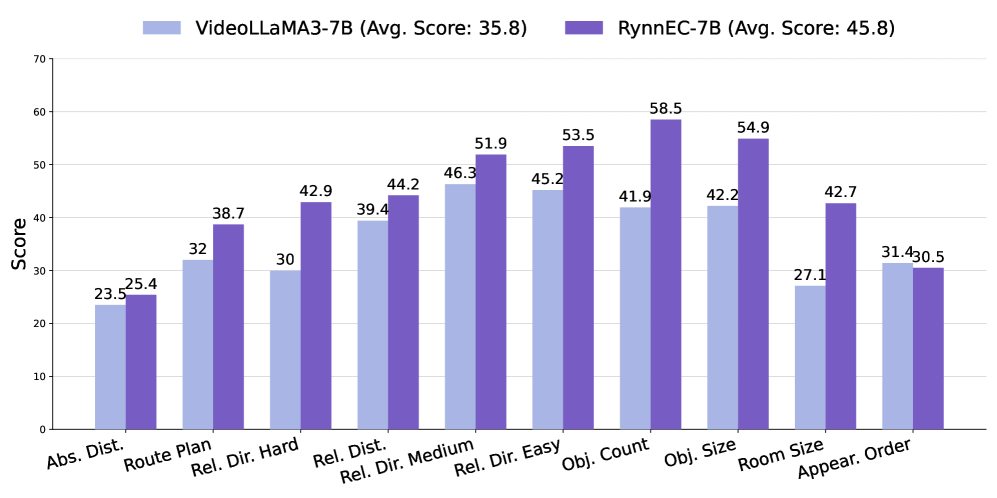
The image displays a grouped bar chart comparing the performance scores of two AI models, **VideoLLaMA3-7B** and **RynnEC-7B**, across ten distinct spatial reasoning evaluation categories. The chart visually demonstrates that RynnEC-7B achieves a higher average score and outperforms VideoLLaMA3-7B in every single category presented.
### Components/Axes
* **Chart Type:** Grouped Bar Chart.
* **Legend:** Located at the top center of the chart.
* **Light Blue Bar:** VideoLLaMA3-7B (Avg. Score: 35.8)
* **Purple Bar:** RynnEC-7B (Avg. Score: 45.8)
* **Y-Axis:**
* **Label:** "Score"
* **Scale:** Linear scale from 0 to 70, with major gridlines at intervals of 10.
* **X-Axis:** Lists ten evaluation categories. The labels are rotated at a 45-degree angle for readability.
* **Categories (from left to right):** Abs. Dist., Route Plan, Rel. Dir. Hard, Rel. Dist., Rel. Dir. Medium, Rel. Dir. Easy, Obj. Count, Obj. Size, Room Size, Appear. Order.
### Detailed Analysis
The following table reconstructs the data presented in the chart. Each row corresponds to a category on the x-axis, with scores for both models.
| Category | VideoLLaMA3-7B Score | RynnEC-7B Score | Performance Difference (RynnEC - VideoLLaMA) |
| :--- | :--- | :--- | :--- |
| Abs. Dist. | 23.5 | 25.4 | +1.9 |
| Route Plan | 32.0 | 38.7 | +6.7 |
| Rel. Dir. Hard | 30.0 | 42.9 | +12.9 |
| Rel. Dist. | 39.4 | 44.2 | +4.8 |
| Rel. Dir. Medium | 46.3 | 51.9 | +5.6 |
| Rel. Dir. Easy | 45.2 | 53.5 | +8.3 |
| Obj. Count | 41.9 | 58.5 | +16.6 |
| Obj. Size | 42.2 | 54.9 | +12.7 |
| Room Size | 27.1 | 42.7 | +15.6 |
| Appear. Order | 31.4 | 30.5 | -0.9 |
**Trend Verification per Category:**
* **Abs. Dist.:** Both bars are low, with the purple bar (RynnEC) slightly taller.
* **Route Plan:** Both bars are taller than the previous category, with a clear lead for the purple bar.
* **Rel. Dir. Hard:** The light blue bar dips slightly, while the purple bar shows a significant increase.
* **Rel. Dist.:** Both bars show a moderate increase from the previous category.
* **Rel. Dir. Medium:** Both bars continue to rise, with the purple bar crossing the 50-point mark.
* **Rel. Dir. Easy:** Both bars are tall, with the purple bar showing a strong lead.
* **Obj. Count:** The purple bar reaches its peak height on the chart, showing the largest performance gap.
* **Obj. Size:** Both bars remain high, with the purple bar still significantly taller.
* **Room Size:** The light blue bar drops sharply, while the purple bar maintains a relatively high score.
* **Appear. Order:** This is the only category where the light blue bar (VideoLLaMA3-7B) is taller than the purple bar (RynnEC-7B), though the difference is minimal.
### Key Observations
1. **Consistent Superiority:** RynnEC-7B (purple) scores higher than VideoLLaMA3-7B (light blue) in 9 out of 10 categories.
2. **Largest Performance Gaps:** The most significant advantages for RynnEC-7B are in **Obj. Count (+16.6)**, **Room Size (+15.6)**, **Rel. Dir. Hard (+12.9)**, and **Obj. Size (+12.7)**.
3. **Only Exception:** The **Appear. Order** category is the sole instance where VideoLLaMA3-7B has a marginally higher score (31.4 vs. 30.5).
4. **Score Range:** VideoLLaMA3-7B's scores range from a low of 23.5 (Abs. Dist.) to a high of 46.3 (Rel. Dir. Medium). RynnEC-7B's scores range from 25.4 (Abs. Dist.) to a high of 58.5 (Obj. Count).
5. **Average Score Confirmation:** The stated average scores in the legend (35.8 vs. 45.8) are consistent with the visual data, where the purple bars are, on average, noticeably taller.
### Interpretation
This chart provides a comparative benchmark for two vision-language models on a suite of spatial reasoning tasks. The data strongly suggests that the **RynnEC-7B model has a significantly more robust capability for spatial understanding** compared to VideoLLaMA3-7B across a diverse set of challenges.
The tasks appear to range from basic spatial relationships ("Rel. Dir. Easy") to more complex reasoning involving counting, sizing, and navigation ("Obj. Count," "Route Plan," "Room Size"). RynnEC-7B's largest leads are in tasks requiring quantitative spatial judgment (counting objects, estimating room size) and handling difficult directional relationships, indicating a potential architectural or training advantage in these specific areas.
The near-parity in "Appear. Order" suggests both models have similar, and relatively weaker, performance on tasks involving temporal sequencing of visual events compared to static spatial reasoning. The overall pattern indicates that while both models struggle most with "Abs. Dist." (absolute distance estimation), RynnEC-7B demonstrates a more generalized and powerful spatial reasoning engine, making it the more capable model for applications requiring detailed scene understanding, such as robotics navigation, visual question answering about spatial layouts, or video comprehension.