## Bar Chart: Model Performance Comparison (VideoLLaMA3-7B vs RynnEC-7B)
### Overview
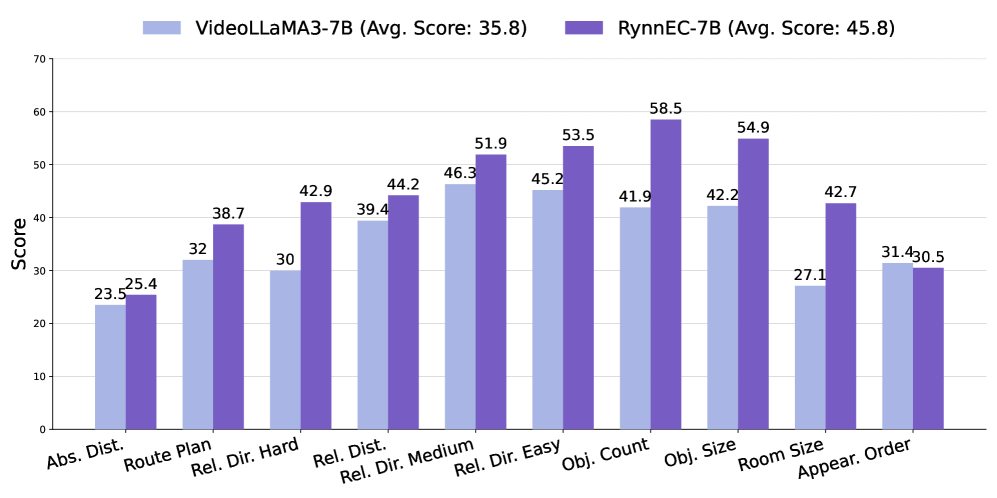
The chart compares the performance of two AI models, VideoLLaMA3-7B (light blue) and RynnEC-7B (purple), across 10 distinct tasks. Scores range from 0 to 70 on the y-axis, with task categories on the x-axis. VideoLLaMA3-7B has an average score of 35.8, while RynnEC-7B averages 45.8.
### Components/Axes
- **X-Axis (Tasks)**:
- Abs. Dist.
- Route Plan
- Rel. Dir. Hard
- Rel. Dist.
- Rel. Dir. Medium
- Rel. Dir. Easy
- Obj. Count
- Obj. Size
- Room Size
- Appear. Order
- **Y-Axis (Score)**: Numerical scale from 0 to 70.
- **Legend**:
- Light blue = VideoLLaMA3-7B (Avg. Score: 35.8)
- Purple = RynnEC-7B (Avg. Score: 45.8)
- **Title**: "VideoLLaMA3-7B (Avg. Score: 35.8) vs RynnEC-7B (Avg. Score: 45.8)"
### Detailed Analysis
1. **Abs. Dist.**:
- VideoLLaMA3-7B: 23.5
- RynnEC-7B: 25.4
2. **Route Plan**:
- VideoLLaMA3-7B: 32
- RynnEC-7B: 38.7
3. **Rel. Dir. Hard**:
- VideoLLaMA3-7B: 30
- RynnEC-7B: 42.9
4. **Rel. Dist.**:
- VideoLLaMA3-7B: 39.4
- RynnEC-7B: 44.2
5. **Rel. Dir. Medium**:
- VideoLLaMA3-7B: 46.3
- RynnEC-7B: 51.9
6. **Rel. Dir. Easy**:
- VideoLLaMA3-7B: 45.2
- RynnEC-7B: 53.5
7. **Obj. Count**:
- VideoLLaMA3-7B: 41.9
- RynnEC-7B: 58.5
8. **Obj. Size**:
- VideoLLaMA3-7B: 42.2
- RynnEC-7B: 54.9
9. **Room Size**:
- VideoLLaMA3-7B: 27.1
- RynnEC-7B: 42.7
10. **Appear. Order**:
- VideoLLaMA3-7B: 31.4
- RynnEC-7B: 30.5
### Key Observations
- **RynnEC-7B Dominance**: Outperforms VideoLLaMA3-7B in 8/10 tasks, with the largest gap in "Obj. Count" (58.5 vs 41.9).
- **VideoLLaMA3-7B Weaknesses**: Lowest scores in "Abs. Dist." (23.5) and "Room Size" (27.1).
- **Consistency**: RynnEC-7B maintains higher scores across relational and object-based tasks.
- **Anomaly**: RynnEC-7B scores lower than VideoLLaMA3-7B in "Appear. Order" (30.5 vs 31.4).
### Interpretation
The data suggests RynnEC-7B excels in tasks requiring relational understanding and object manipulation, while VideoLLaMA3-7B struggles with absolute distance estimation and room size assessment. The 10-point average gap (45.8 vs 35.8) indicates RynnEC-7B’s broader capability, though both models show task-specific limitations. The near-tie in "Appear. Order" highlights potential trade-offs in model design priorities.