## Histogram: Probability Distribution of Samples at Low and High Temperatures
### Overview
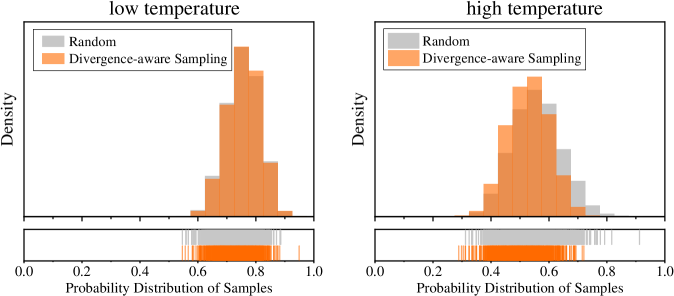
The image presents two histograms comparing the probability distribution of samples obtained through "Random" and "Divergence-aware Sampling" methods under "low temperature" and "high temperature" conditions. Each histogram also includes a rug plot below it, showing the individual sample locations.
### Components/Axes
* **Titles:** "low temperature" (left histogram), "high temperature" (right histogram)
* **Y-axis:** "Density" (same for both histograms)
* **X-axis:** "Probability Distribution of Samples" (same for both histograms), ranging from 0.0 to 1.0 with increments of 0.2.
* **Legend:** Located in the top-left corner of each histogram.
* Gray: "Random"
* Orange: "Divergence-aware Sampling"
### Detailed Analysis
**1. Low Temperature Histogram:**
* **Random (Gray):** The distribution is centered around 0.7, with a spread from approximately 0.5 to 0.9.
* **Divergence-aware Sampling (Orange):** The distribution is also centered around 0.7, but appears to be more concentrated than the "Random" distribution. The spread is approximately from 0.6 to 0.9.
* **Rug Plot:** The rug plot shows individual samples. The "Divergence-aware Sampling" samples are more clustered between 0.6 and 0.8, while the "Random" samples are more dispersed.
**2. High Temperature Histogram:**
* **Random (Gray):** The distribution is centered around 0.5, with a spread from approximately 0.3 to 0.7.
* **Divergence-aware Sampling (Orange):** The distribution is centered around 0.5, but appears to be more concentrated than the "Random" distribution. The spread is approximately from 0.4 to 0.7.
* **Rug Plot:** The rug plot shows individual samples. The "Divergence-aware Sampling" samples are more clustered between 0.4 and 0.6, while the "Random" samples are more dispersed.
### Key Observations
* In both temperature conditions, "Divergence-aware Sampling" results in a more concentrated distribution of samples compared to "Random" sampling.
* The "high temperature" distributions are shifted slightly to the left compared to the "low temperature" distributions.
* The rug plots visually confirm the concentration of samples in "Divergence-aware Sampling" and the dispersion in "Random" sampling.
### Interpretation
The data suggests that "Divergence-aware Sampling" is more effective at focusing on a specific region of the probability distribution compared to "Random" sampling, regardless of the temperature. This could be beneficial in scenarios where it's important to sample from a specific, high-probability region. The shift in distributions between low and high temperatures indicates that temperature influences the overall probability distribution of the samples. The "Divergence-aware Sampling" method appears to be more robust to temperature changes, maintaining a concentrated distribution even at higher temperatures.