\n
## Histograms: Probability Distribution of Samples at Low and High Temperatures
### Overview
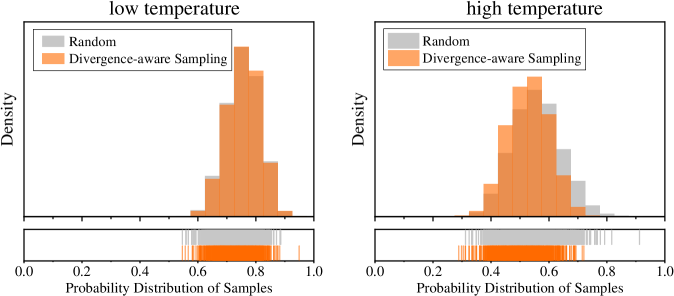
The image presents two histograms, side-by-side, comparing the probability distribution of samples obtained using "Random" and "Divergence-aware Sampling" methods at "low temperature" and "high temperature" settings. Both histograms share the same axes, allowing for a direct comparison of the distributions under different sampling methods and temperature conditions.
### Components/Axes
* **X-axis:** "Probability Distribution of Samples" ranging from 0.0 to 1.0.
* **Y-axis:** "Density". The scale is not explicitly marked, but it represents the relative frequency or probability density of samples within each bin.
* **Legends:** Located in the top-left corner of each histogram.
* "Random" - represented by a gray color.
* "Divergence-aware Sampling" - represented by an orange color.
* **Titles:**
* Left Histogram: "low temperature"
* Right Histogram: "high temperature"
### Detailed Analysis
**Left Histogram (Low Temperature):**
* **Random Sampling (Gray):** The distribution is relatively flat and spread out across the range of 0.0 to 1.0, with a slight concentration of samples between 0.2 and 0.4. The density appears to be low across most of the range.
* **Divergence-aware Sampling (Orange):** This distribution is highly concentrated towards the higher end of the probability scale, peaking around 0.7-0.9. The density is significantly higher than that of the Random Sampling distribution. The distribution is unimodal.
* Approximate Data Points (Orange):
* Peak Density: Approximately 0.75-0.85 on the x-axis.
* Significant Density Range: 0.6 to 0.95.
* Density near 0.0: Very low, almost zero.
**Right Histogram (High Temperature):**
* **Random Sampling (Gray):** Similar to the low temperature case, the distribution is relatively flat and spread out, but with a slightly broader distribution.
* **Divergence-aware Sampling (Orange):** The distribution is still concentrated towards the higher end of the probability scale, but it is more spread out and less sharply peaked compared to the low temperature case. The peak is around 0.6-0.8.
* Approximate Data Points (Orange):
* Peak Density: Approximately 0.65-0.75 on the x-axis.
* Significant Density Range: 0.5 to 0.9.
* Density near 0.0: Very low, almost zero.
### Key Observations
* **Temperature Effect:** As the temperature increases, the Divergence-aware Sampling distribution becomes broader and less peaked.
* **Sampling Method Effect:** Divergence-aware Sampling consistently produces a distribution skewed towards higher probability values compared to Random Sampling, regardless of temperature.
* **Random Sampling Consistency:** The Random Sampling distribution remains relatively consistent across both temperature settings.
* **Density Difference:** The density of the Divergence-aware Sampling distribution is significantly higher than the Random Sampling distribution at both temperatures.
### Interpretation
The data suggests that Divergence-aware Sampling is more effective at focusing samples on regions of higher probability compared to Random Sampling. This effect is more pronounced at lower temperatures, where the distribution becomes highly concentrated. At higher temperatures, the increased entropy (represented by the broader distribution) leads to a less focused distribution even with Divergence-aware Sampling.
The difference in distributions between the two sampling methods indicates that Divergence-aware Sampling is sensitive to the underlying probability landscape and can effectively exploit this information to generate more informative samples. The temperature parameter controls the level of randomness in the sampling process; lower temperatures lead to more deterministic sampling, while higher temperatures introduce more randomness.
The consistent flatness of the Random Sampling distribution suggests that it does not effectively leverage the underlying probability distribution, resulting in a more uniform sampling of the probability space. This could be due to the lack of any mechanism to prioritize regions of higher probability.
The histograms demonstrate a clear trade-off between exploration (Random Sampling) and exploitation (Divergence-aware Sampling). Random Sampling explores the entire probability space, while Divergence-aware Sampling exploits the regions of higher probability. The optimal choice of sampling method depends on the specific application and the desired balance between exploration and exploitation.