## Histograms: Comparison of Sampling Distributions at Low vs. High Temperature
### Overview
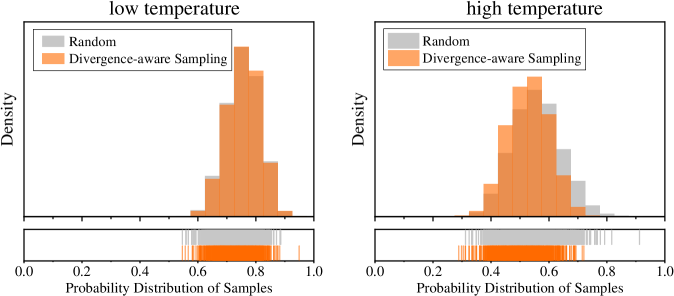
The image displays two side-by-side histograms comparing the probability distributions of samples generated by two methods—"Random" and "Divergence-aware Sampling"—under two different conditions: "low temperature" (left panel) and "high temperature" (right panel). Each panel includes a main density histogram and a supplementary rug plot below it.
### Components/Axes
* **Titles:** "low temperature" (left panel), "high temperature" (right panel).
* **Y-axis (both panels):** Labeled "Density". The scale is not numerically marked, indicating relative frequency.
* **X-axis (both panels):** Labeled "Probability Distribution of Samples". The scale runs from 0.0 to 1.0, with major ticks at 0.0, 0.2, 0.4, 0.6, 0.8, and 1.0.
* **Legend (both panels):** Located in the top-left corner of each plot.
* Gray square: "Random"
* Orange square: "Divergence-aware Sampling"
* **Rug Plots:** Located directly below each histogram, aligned with the x-axis. They show individual data points as vertical lines. Gray lines correspond to the "Random" method, and orange lines correspond to "Divergence-aware Sampling".
### Detailed Analysis
**1. Low Temperature Panel (Left):**
* **Trend Verification:** The "Divergence-aware Sampling" (orange) distribution is sharply peaked and narrow. The "Random" (gray) distribution is broader and shorter, but its central mass overlaps significantly with the orange distribution.
* **Data Points & Distribution:**
* **Divergence-aware Sampling (Orange):** The distribution is unimodal and highly concentrated. It peaks sharply in the interval approximately between 0.7 and 0.8. The bulk of its density lies between ~0.6 and ~0.9. The rug plot shows a dense cluster of orange lines in this same range.
* **Random (Gray):** The distribution is wider and flatter. Its central tendency appears to be in a similar region as the orange distribution (around 0.7-0.8), but it has significant density extending from approximately 0.5 to 0.9. The gray rug lines are more spread out than the orange ones.
**2. High Temperature Panel (Right):**
* **Trend Verification:** Both distributions are wider and more overlapping compared to the low-temperature case. The "Divergence-aware Sampling" (orange) distribution is still somewhat more concentrated than the "Random" (gray) one, but the distinction is less pronounced.
* **Data Points & Distribution:**
* **Divergence-aware Sampling (Orange):** The distribution is broader than in the low-temperature case. It appears bimodal or has a wide plateau, with high density spanning from approximately 0.4 to 0.7. The peak is less defined. The orange rug lines are spread across this wider interval.
* **Random (Gray):** This distribution is the broadest of all. It spans from roughly 0.3 to 0.9, with a central mass around 0.5 to 0.7. It shows a notable secondary concentration or shoulder around 0.7-0.8. The gray rug lines are very widely dispersed.
### Key Observations
1. **Effect of Temperature:** Increasing the temperature parameter dramatically increases the variance (spread) of the sample distributions for both methods.
2. **Method Comparison:** At both temperatures, "Divergence-aware Sampling" produces a more concentrated distribution of sample probabilities than "Random" sampling. This effect is much stronger at low temperature.
3. **Distribution Shift:** The central tendency of the "Divergence-aware Sampling" distribution shifts leftward (toward lower probability values) as temperature increases, moving from a peak near 0.75 (low temp) to a broader mass centered around 0.55 (high temp). The "Random" distribution's center shifts less dramatically.
4. **Overlap:** The overlap between the two methods' distributions is significantly greater at high temperature.
### Interpretation
This visualization demonstrates the impact of a "temperature" parameter on sampling behavior in a probabilistic model. Temperature typically controls the randomness or entropy of sampling; low temperature leads to more deterministic, confident sampling (peaked distributions), while high temperature leads to more exploratory, uniform sampling (broad distributions).
The key finding is that **"Divergence-aware Sampling" consistently yields samples with a narrower range of probabilities compared to random sampling, acting as a regularizing or focusing mechanism.** This suggests the method is effective at avoiding extreme or low-probability samples. The effect is most potent at low temperature, where it creates a very sharp peak. At high temperature, where the system is inherently more random, the method still provides some constraining influence, but its advantage over pure random sampling is reduced. The leftward shift of the orange distribution at high temperature indicates that when forced to be more random, the divergence-aware method tends to select samples with moderately lower probabilities than the random baseline, possibly avoiding the high-probability modes that random sampling might still frequently hit.