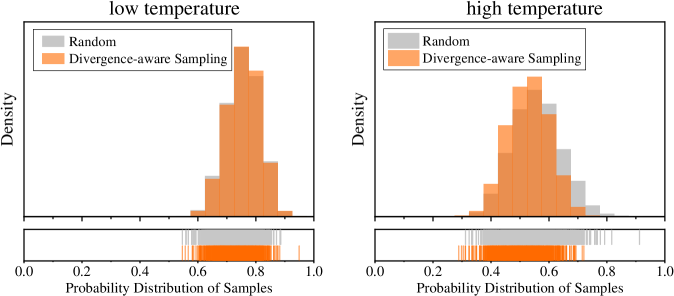
## Histogram Comparison: Sampling Methods at Low and High Temperatures
### Overview
The image presents two side-by-side histograms comparing the probability distribution of samples generated by two methods: "Random" and "Divergence-aware Sampling." The histograms are labeled for "low temperature" (left) and "high temperature" (right). Each histogram uses a legend in the top-left corner to distinguish the two methods via color (gray for Random, orange for Divergence-aware Sampling).
### Components/Axes
- **X-axis**: "Probability Distribution of Samples" (ranges from 0.0 to 1.0).
- **Y-axis**: "Density" (no explicit scale, but relative heights indicate density magnitude).
- **Legend**: Located in the top-left corner of both histograms.
- **Titles**:
- Top-left: "low temperature"
- Top-right: "high temperature"
### Detailed Analysis
#### Low Temperature Histogram
- **Divergence-aware Sampling (orange)**:
- Dominates the distribution with a sharp peak centered near **0.7**.
- Density decreases symmetrically toward 0.5 and 0.9.
- Approximate maximum density: **~0.8** (relative scale).
- **Random (gray)**:
- Flatter distribution with lower overall density.
- Peaks near **0.6** but spreads broadly between **0.4–0.8**.
- Approximate maximum density: **~0.4**.
#### High Temperature Histogram
- **Divergence-aware Sampling (orange)**:
- Broader distribution than the low-temperature case, peaking near **0.6**.
- Density tapers off toward **0.4–0.8**, with a secondary minor peak near **0.8**.
- Approximate maximum density: **~0.7**.
- **Random (gray)**:
- Even flatter distribution, with density spread between **0.3–0.9**.
- Peaks near **0.5** but lacks sharpness.
- Approximate maximum density: **~0.3**.
### Key Observations
1. **Divergence-aware Sampling** consistently produces sharper, more concentrated distributions compared to Random sampling, especially at low temperatures.
2. At high temperatures, both methods show increased spread, but Divergence-aware Sampling retains a higher density in the target probability range (**0.4–0.8**).
3. Random sampling exhibits a uniform bias toward mid-range probabilities (**0.5–0.7**) across both temperature settings.
### Interpretation
The data suggests that **Divergence-aware Sampling** is more effective at focusing sample generation toward higher-probability regions, even as temperature increases (which typically encourages exploration). This implies the method balances exploration and exploitation better than Random sampling. The widening distribution at high temperatures for both methods indicates increased randomness, but Divergence-aware Sampling mitigates this by maintaining a higher density in the desired range.
**Notable Anomalies**:
- At high temperatures, Divergence-aware Sampling shows a minor secondary peak near **0.8**, which may indicate occasional over-concentration in that region.
- Random sampling’s uniform spread suggests no targeted strategy, aligning with its "random" label.