## Dot Plot Matrix: Genome Comparison
### Overview
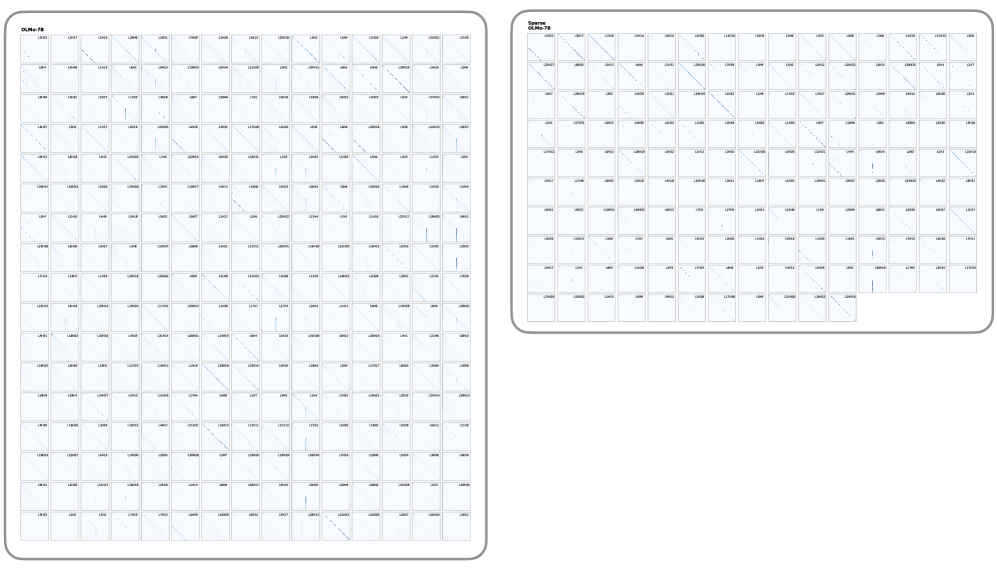
The image presents two dot plot matrices, each comparing the similarity between different segments of a genome. The matrix on the left, labeled "OLMe-78", appears denser, indicating higher sequence similarity across the genome. The matrix on the right, labeled "Sparse OLMe-78", shows a sparser pattern, suggesting lower sequence similarity or more significant rearrangements. Each cell in the matrix represents a comparison between two genomic segments, with dots indicating regions of similarity.
### Components/Axes
* **Title (Left Matrix):** OLMe-78
* **Title (Right Matrix):** Sparse OLMe-78
* **Axes Labels:** Each row and column in both matrices is labeled with "L#", where # is a number ranging from 1 to 112 for the left matrix and 1 to 102 for the right matrix. These labels represent different segments of the genome being compared.
### Detailed Analysis
**Left Matrix (OLMe-78):**
* The matrix is a 112x112 grid.
* Each cell contains a dot plot comparing two segments of the genome.
* The diagonal cells (L1 vs L1, L2 vs L2, etc.) generally show a strong diagonal line, indicating high similarity between a segment and itself.
* Off-diagonal cells show varying degrees of similarity, with some showing diagonal lines or clusters of dots, indicating regions of shared sequence.
* The density of dots in the off-diagonal cells suggests a relatively high degree of sequence similarity across different segments of the genome.
**Right Matrix (Sparse OLMe-78):**
* The matrix is a 102x102 grid.
* Similar to the left matrix, the diagonal cells show strong diagonal lines.
* However, the off-diagonal cells are much sparser, with fewer dots and shorter diagonal lines.
* This indicates a lower degree of sequence similarity between different segments of the genome compared to the left matrix.
* Some cells show vertical or horizontal lines, suggesting potential duplications or rearrangements.
### Key Observations
* The "OLMe-78" matrix shows a higher degree of sequence similarity across the genome compared to the "Sparse OLMe-78" matrix.
* The "Sparse OLMe-78" matrix exhibits more distinct patterns, such as vertical or horizontal lines, suggesting potential genomic rearrangements.
* The diagonal lines in both matrices confirm the self-similarity of each genomic segment.
### Interpretation
The dot plot matrices provide a visual representation of the sequence similarity between different segments of a genome. The "OLMe-78" matrix suggests a relatively stable genome with high sequence conservation across different segments. In contrast, the "Sparse OLMe-78" matrix indicates a genome with lower sequence similarity and potential rearrangements, such as duplications or translocations. The "Sparse OLMe-78" genome may have undergone more evolutionary changes or experienced more genomic instability compared to the "OLMe-78" genome. The sparsity in the "Sparse OLMe-78" matrix could also be due to the presence of unique sequences or insertions that are not shared between different segments of the genome.