## Chart/Diagram Type: Grid Matrix Visualization
### Overview
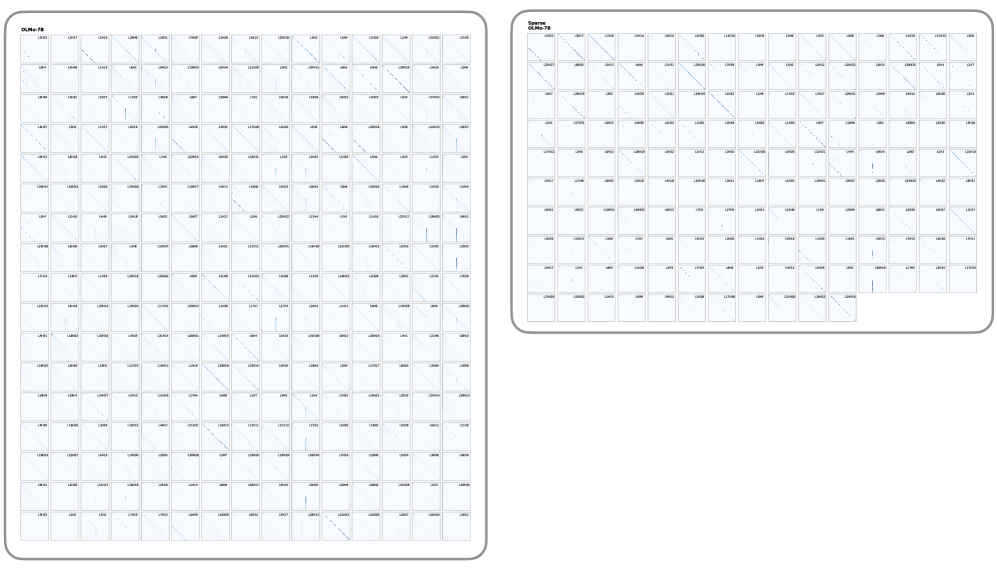
The image contains two grid matrices labeled "GLYPH<0>78" and "Sparse GLYPH<0>78". Both grids are structured as tables with rows and columns, featuring numerical values and occasional slash-separated entries. The grids appear to represent encoded data, coordinates, or identifiers, though their exact purpose is unclear without additional context.
### Components/Axes
- **Headers**:
- Left grid: "GLYPH<0>78" (top-left corner).
- Right grid: "Sparse GLYPH<0>78" (top-left corner).
- **Structure**:
- Left grid: 20 rows × 20 columns.
- Right grid: 15 rows × 15 columns.
- **Cell Content**:
- Numerical values (e.g., "1234", "5678", "9012").
- Slash-separated entries (e.g., "1234/5678", "9012/3456").
- Empty cells (denoted by "").
### Detailed Analysis
#### Left Grid ("GLYPH<0>78")
- **Row/Column Labels**: No explicit axis labels; rows and columns are numbered implicitly (e.g., "1234", "5678").
- **Data Distribution**:
- Most cells contain single numerical values.
- Slash-separated entries appear sporadically (e.g., "1234/5678" in row 5, column 10).
- Empty cells are distributed unevenly, with clusters in the lower half.
#### Right Grid ("Sparse GLYPH<0>78")
- **Row/Column Labels**: Similar to the left grid but with fewer entries.
- **Data Distribution**:
- Higher density of empty cells compared to the left grid.
- Slash-separated entries are less frequent.
- Numerical values are more concentrated in the upper half.
### Key Observations
1. **Sparsity**: The right grid ("Sparse GLYPH<0>78") has significantly more empty cells, suggesting a reduced data density.
2. **Formatting**: Slash-separated entries may indicate composite values (e.g., coordinates, ranges, or error codes).
3. **Numerical Patterns**: No clear numerical trends (e.g., increasing/decreasing values) are visually apparent.
### Interpretation
The grids likely represent structured data sets, possibly for:
- **Coordinate Systems**: Numbers could denote spatial or temporal coordinates.
- **Error Codes/Statuses**: Slash-separated entries might encode multiple states (e.g., "1234/5678" = "Active/Inactive").
- **Matrix Representations**: The grids could model relationships between variables (e.g., adjacency matrices, frequency tables).
The "Sparse" label implies the right grid is a simplified or filtered version of the left grid, retaining only critical data points. Without additional context (e.g., axis units, legends), the exact meaning of the numbers remains ambiguous. Further analysis would require metadata or domain-specific knowledge.