\n
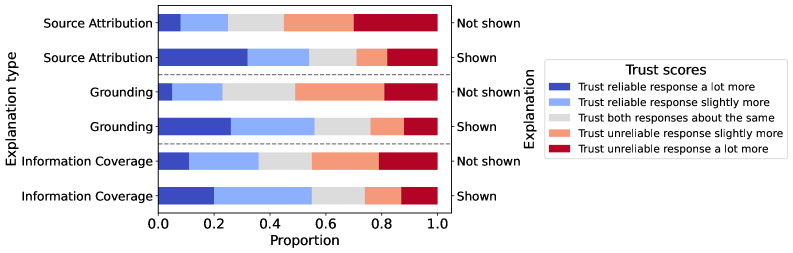
## Stacked Bar Chart: Explanation Type vs. Trust Scores
### Overview
The image presents a stacked bar chart comparing "Explanation Type" (Source Attribution, Grounding, Information Coverage) with "Trust Scores" (Trust reliable response a lot more, Trust reliable response slightly more, Trust both responses about the same, Trust unreliable response slightly more, Trust unreliable response a lot more). The chart differentiates between cases where the explanation is "Shown" versus "Not shown". The x-axis represents "Proportion" ranging from 0.0 to 1.0.
### Components/Axes
* **Y-axis:** "Explanation type" with categories: "Source Attribution", "Grounding", "Information Coverage".
* **X-axis:** "Proportion" with a scale from 0.0 to 1.0, marked at 0.2, 0.4, 0.6, 0.8, and 1.0.
* **Legend (Top-right):** "Trust scores" with the following color-coded categories:
* Light Blue: "Trust reliable response a lot more"
* Blue: "Trust reliable response slightly more"
* Gray: "Trust both responses about the same"
* Orange: "Trust unreliable response slightly more"
* Red: "Trust unreliable response a lot more"
* **Horizontal dashed line:** Separates "Not shown" and "Shown" explanations.
### Detailed Analysis
The chart consists of six stacked bars, each representing a combination of Explanation Type and whether the explanation was Shown or Not Shown.
**1. Source Attribution - Not shown:**
* Light Blue (Trust reliable response a lot more): Approximately 0.15
* Blue (Trust reliable response slightly more): Approximately 0.25
* Gray (Trust both responses about the same): Approximately 0.20
* Orange (Trust unreliable response slightly more): Approximately 0.20
* Red (Trust unreliable response a lot more): Approximately 0.20
**2. Source Attribution - Shown:**
* Light Blue (Trust reliable response a lot more): Approximately 0.30
* Blue (Trust reliable response slightly more): Approximately 0.35
* Gray (Trust both responses about the same): Approximately 0.15
* Orange (Trust unreliable response slightly more): Approximately 0.10
* Red (Trust unreliable response a lot more): Approximately 0.10
**3. Grounding - Not shown:**
* Light Blue (Trust reliable response a lot more): Approximately 0.10
* Blue (Trust reliable response slightly more): Approximately 0.30
* Gray (Trust both responses about the same): Approximately 0.25
* Orange (Trust unreliable response slightly more): Approximately 0.20
* Red (Trust unreliable response a lot more): Approximately 0.15
**4. Grounding - Shown:**
* Light Blue (Trust reliable response a lot more): Approximately 0.40
* Blue (Trust reliable response slightly more): Approximately 0.35
* Gray (Trust both responses about the same): Approximately 0.10
* Orange (Trust unreliable response slightly more): Approximately 0.10
* Red (Trust unreliable response a lot more): Approximately 0.05
**5. Information Coverage - Not shown:**
* Light Blue (Trust reliable response a lot more): Approximately 0.05
* Blue (Trust reliable response slightly more): Approximately 0.25
* Gray (Trust both responses about the same): Approximately 0.30
* Orange (Trust unreliable response slightly more): Approximately 0.25
* Red (Trust unreliable response a lot more): Approximately 0.15
**6. Information Coverage - Shown:**
* Light Blue (Trust reliable response a lot more): Approximately 0.35
* Blue (Trust reliable response slightly more): Approximately 0.30
* Gray (Trust both responses about the same): Approximately 0.15
* Orange (Trust unreliable response slightly more): Approximately 0.10
* Red (Trust unreliable response a lot more): Approximately 0.10
### Key Observations
* For all explanation types, showing the explanation generally shifts the proportion towards higher trust in reliable responses (light blue and blue segments increase).
* The largest shift towards higher trust is observed for "Grounding" when shown.
* "Information Coverage" consistently has the lowest proportion of "Trust reliable response a lot more" even when the explanation is shown.
* The proportion of "Trust unreliable response a lot more" (red segment) is generally reduced when the explanation is shown.
### Interpretation
The data suggests that providing explanations (showing vs. not showing) generally increases trust in reliable responses across all explanation types. This indicates that transparency and justification are valuable in building user confidence. The most significant impact of showing an explanation is observed for "Grounding," suggesting that providing context about the basis of the response is particularly important for establishing trust. The relatively lower trust scores for "Information Coverage" even with explanations shown might indicate that the information itself is less inherently trustworthy or that the explanations provided for information coverage are less effective. The chart highlights the importance of explainability in AI systems and suggests that different explanation types have varying impacts on user trust. The consistent trend of reduced distrust (red segment) when explanations are shown reinforces the value of transparency.