## Scatter Plot: Gemini Model Refusal Rate Comparison
### Overview
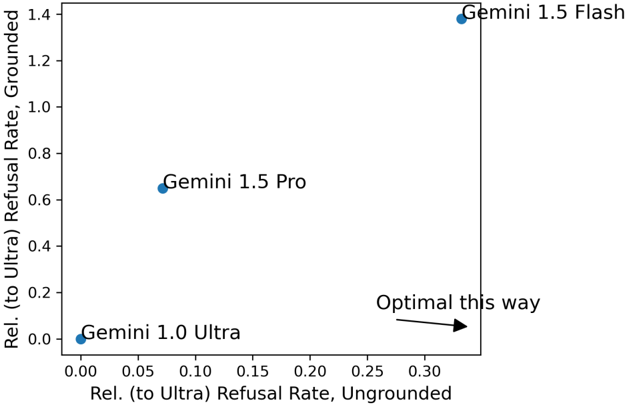
The image is a scatter plot comparing the refusal rates of different Gemini models relative to the "Ultra" baseline. The plot uses two axes to distinguish between "Ungrounded" and "Grounded" refusal rates, with an arrow indicating an "Optimal" direction.
### Components/Axes
- **X-axis**: "Rel. (to Ultra) Refusal Rate, Ungrounded" (range: 0.00 to 0.30)
- **Y-axis**: "Rel. (to Ultra) Refusal Rate, Grounded" (range: 0.0 to 1.4)
- **Data Points**:
- **Gemini 1.0 Ultra**: (0.00, 0.00)
- **Gemini 1.5 Pro**: (0.07, 0.62)
- **Gemini 1.5 Flash**: (0.32, 1.38)
- **Arrow**: Labeled "Optimal this way", pointing from the origin (bottom-left) toward the top-right quadrant.
### Detailed Analysis
- **Gemini 1.0 Ultra** is positioned at the origin (0.00, 0.00), serving as the baseline for comparison.
- **Gemini 1.5 Pro** is located at (0.07, 0.62), indicating a moderate increase in both ungrounded and grounded refusal rates compared to Ultra.
- **Gemini 1.5 Flash** is at (0.32, 1.38), showing the highest values on both axes, significantly outperforming other models in refusal rates.
- The arrow labeled "Optimal this way" suggests that higher values on both axes (i.e., greater refusal rates in both grounded and ungrounded contexts) are considered optimal.
### Key Observations
1. **Trend Verification**:
- The data points form a diagonal progression from the origin (Ultra) to the top-right (Flash), indicating a positive correlation between model versions and refusal rates.
- The arrow reinforces this trend, explicitly marking the direction of improvement.
2. **Outliers/Anomalies**:
- No outliers are present; all points align with the expected progression.
- The Flash model’s values exceed the axis ranges (x: 0.32 > 0.30, y: 1.38 > 1.4), suggesting potential data truncation or scaling limitations.
### Interpretation
The plot demonstrates that newer Gemini models (1.5 Pro and Flash) exhibit higher refusal rates than the original Ultra model, with Flash achieving the highest rates in both grounded and ungrounded contexts. The "Optimal this way" arrow implies that increased refusal rates are desirable, likely reflecting improved safety, accuracy, or adherence to guidelines. However, the exact rationale for "optimal" requires domain-specific context (e.g., balancing helpfulness vs. caution). The Flash model’s performance suggests it may prioritize stricter content moderation or risk mitigation compared to earlier versions.