\n
## Scatter Plot: Gemini Model Refusal Rates
### Overview
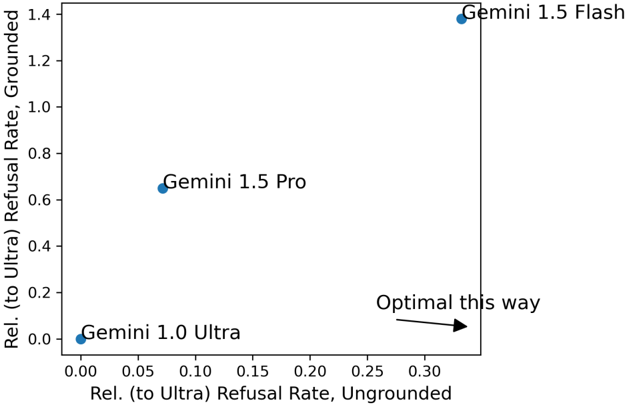
This image presents a scatter plot comparing the refusal rates of three Gemini models: Gemini 1.0 Ultra, Gemini 1.5 Pro, and Gemini 1.5 Flash. The plot visualizes the relationship between "Rel. (to Ultra) Refusal Rate, Ungrounded" on the x-axis and "Rel. (to Ultra) Refusal Rate, Grounded" on the y-axis. The goal appears to be identifying models with lower refusal rates, with a preference for lower ungrounded refusal rates and higher grounded refusal rates.
### Components/Axes
* **X-axis:** "Rel. (to Ultra) Refusal Rate, Ungrounded". Scale ranges from approximately 0.00 to 0.35.
* **Y-axis:** "Rel. (to Ultra) Refusal Rate, Grounded". Scale ranges from approximately 0.00 to 1.40.
* **Data Points:** Three data points representing the Gemini models.
* Gemini 1.0 Ultra
* Gemini 1.5 Pro
* Gemini 1.5 Flash
* **Annotation:** "Optimal this way" with an arrow pointing to the right, indicating that increasing values on the x-axis (ungrounded refusal rate) are undesirable.
### Detailed Analysis
* **Gemini 1.0 Ultra:** Located at approximately (0.02, 0.03). This model has the lowest refusal rates for both grounded and ungrounded responses.
* **Gemini 1.5 Pro:** Located at approximately (0.10, 0.65). This model exhibits a higher grounded refusal rate and a slightly higher ungrounded refusal rate compared to Gemini 1.0 Ultra.
* **Gemini 1.5 Flash:** Located at approximately (0.30, 1.40). This model has the highest refusal rates for both grounded and ungrounded responses.
The trend is that as the ungrounded refusal rate increases, the grounded refusal rate also increases.
### Key Observations
* Gemini 1.0 Ultra demonstrates the lowest refusal rates across both categories.
* Gemini 1.5 Flash has significantly higher refusal rates than the other two models.
* Gemini 1.5 Pro falls between the other two models in terms of refusal rates.
* The "Optimal this way" arrow suggests that a lower ungrounded refusal rate is preferred, even if it means a slightly higher grounded refusal rate.
### Interpretation
The data suggests a trade-off between grounded and ungrounded refusal rates. Gemini 1.0 Ultra appears to be the most conservative model, refusing fewer requests overall. Gemini 1.5 Flash, while potentially more capable, is also more likely to refuse requests, particularly those that are ungrounded. Gemini 1.5 Pro represents a middle ground.
The positioning of the models on the plot indicates that increasing the ungrounded refusal rate also increases the grounded refusal rate. This could be due to the models' internal mechanisms for identifying and rejecting potentially harmful or inappropriate requests. The annotation "Optimal this way" implies that the developers prioritize minimizing ungrounded refusals, even if it means accepting a higher rate of grounded refusals. This could be because ungrounded refusals are more likely to frustrate users or lead to inaccurate responses.
The plot is a useful visualization for understanding the safety and reliability characteristics of different Gemini models. It allows for a direct comparison of their refusal rates and highlights the trade-offs involved in model design. The data suggests that the choice of model should depend on the specific application and the relative importance of minimizing different types of refusals.