\n
## Diagram: Directed Graph with Node and Edge Labels
### Overview
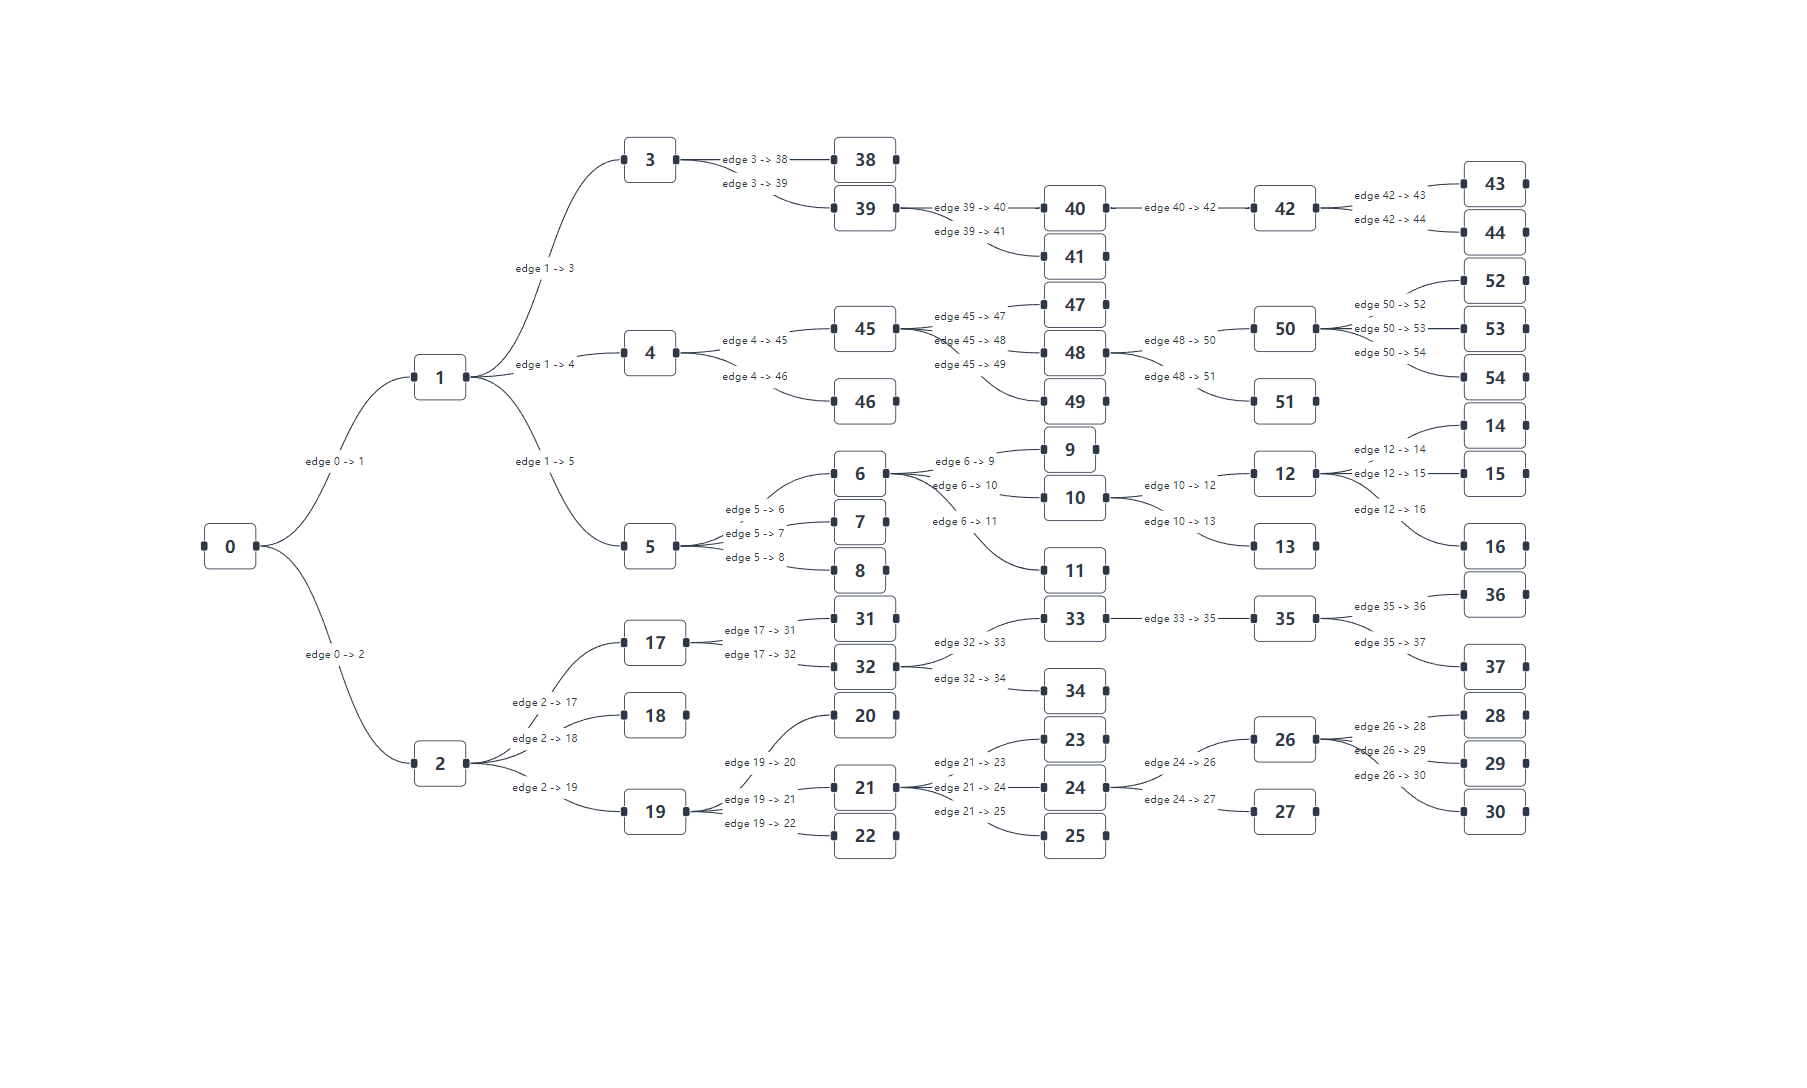
The image depicts a directed graph consisting of numbered nodes (0-54) connected by labeled edges. The graph appears to be a network or flow diagram, with arrows indicating the direction of relationships between nodes. The nodes are represented as black circles, and the edges are labeled with "edge X -> Y", indicating a connection from node X to node Y.
### Components/Axes
The diagram consists solely of nodes and edges. There are no explicit axes or scales. The nodes are numbered from 0 to 54. The edges are labeled with source and destination node numbers.
### Detailed Analysis or Content Details
The diagram contains 55 nodes (0-54) and numerous directed edges. Here's a breakdown of the connections, transcribed from the image:
* edge 0 -> 1
* edge 1 -> 3
* edge 1 -> 4
* edge 1 -> 5
* edge 2 -> 17
* edge 2 -> 18
* edge 2 -> 19
* edge 3 -> 38
* edge 3 -> 39
* edge 4 -> 45
* edge 4 -> 46
* edge 5 -> 7
* edge 5 -> 8
* edge 6 -> 9
* edge 6 -> 10
* edge 7 -> 11
* edge 8 -> 11
* edge 9 -> 12
* edge 10 -> 12
* edge 10 -> 13
* edge 11 -> 13
* edge 11 -> 14
* edge 12 -> 15
* edge 12 -> 16
* edge 13 -> 16
* edge 17 -> 31
* edge 17 -> 32
* edge 18 -> 20
* edge 18 -> 21
* edge 19 -> 22
* edge 19 -> 23
* edge 20 -> 23
* edge 20 -> 24
* edge 21 -> 24
* edge 21 -> 25
* edge 22 -> 24
* edge 22 -> 26
* edge 23 -> 26
* edge 23 -> 27
* edge 24 -> 27
* edge 24 -> 28
* edge 25 -> 28
* edge 25 -> 29
* edge 26 -> 28
* edge 26 -> 30
* edge 27 -> 30
* edge 27 -> 31
* edge 28 -> 31
* edge 28 -> 36
* edge 29 -> 36
* edge 29 -> 37
* edge 30 -> 37
* edge 31 -> 33
* edge 32 -> 33
* edge 32 -> 34
* edge 33 -> 35
* edge 34 -> 35
* edge 35 -> 36
* edge 35 -> 37
* edge 38 -> 40
* edge 39 -> 41
* edge 40 -> 42
* edge 41 -> 42
* edge 42 -> 43
* edge 42 -> 44
* edge 43 -> 44
* edge 44 -> 52
* edge 45 -> 47
* edge 45 -> 48
* edge 46 -> 48
* edge 46 -> 49
* edge 47 -> 50
* edge 48 -> 50
* edge 49 -> 51
* edge 50 -> 52
* edge 50 -> 53
* edge 51 -> 54
* edge 52 -> 54
* edge 53 -> 54
* edge 54 -> 14
### Key Observations
The graph is densely connected, particularly around nodes 1, 2, 6, 17, 20, 22, 23, 24, 26, 27, 28, 31, 32, 33, 35, 45, 46, 47, 48, 50, and 52. Node 1 appears to be a central hub, with connections to nodes 3, 4, and 5. Node 54 has incoming edges from 52, 53, and 51, and an outgoing edge to 14.
### Interpretation
This diagram likely represents a flow or dependency network. The nodes could represent tasks, states, or entities, and the edges represent the relationships or transitions between them. The labeling of edges as "edge X -> Y" suggests a directed flow from node X to node Y.
The density of connections around certain nodes indicates that those nodes are critical points in the network. For example, node 1 is a central hub, suggesting it controls or influences multiple downstream processes. The connections to node 54 suggest it is a final state or destination.
The diagram could be used to model a variety of systems, such as a workflow, a state machine, or a communication network. Without additional context, it is difficult to determine the specific meaning of the nodes and edges. The diagram appears to be a visualization of a complex system, and its purpose is to illustrate the relationships between its components. The presence of numbered edges suggests a possible ordering or prioritization of connections.