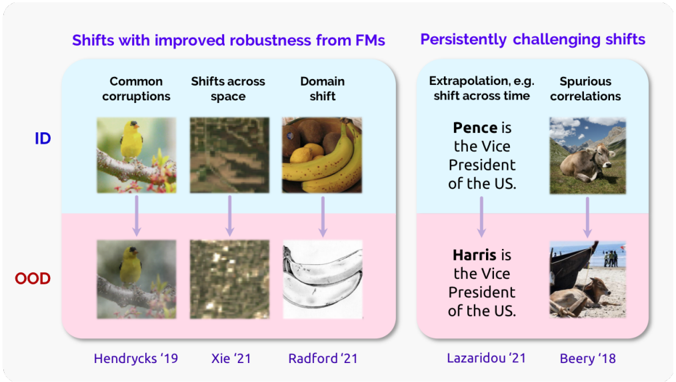
## Diagram: Shifts in Robustness and Challenges for Machine Learning Models
### Overview
The diagram compares two categories of shifts affecting machine learning (ML) model robustness:
1. **Shifts with improved robustness from FMs** (left section, blue background)
2. **Persistently challenging shifts** (right section, pink background)
Each category contains subcategories with visual examples, textual annotations, and citations. The diagram uses spatial grounding (arrows, labels) to illustrate relationships between concepts.
---
### Components/Axes
#### Main Sections
- **Left Section (Improved Robustness from FMs)**
- Subcategories:
1. **Common corruptions**
- Image: Yellow bird on a branch (ID) → Blurred bird (OOD)
- Citation: Hendrycks '19
2. **Shifts across space**
- Image: Forest floor (ID) → Abstract texture (OOD)
- Citation: Xie '21
3. **Domain shift**
- Image: Bananas (ID) → Banana peel (OOD)
- Citation: Radford '21
- **Right Section (Persistently Challenging Shifts)**
- Subcategories:
1. **Extrapolation, e.g., shift across time**
- Text: "Pence is the Vice President of the US." (ID) → "Harris is the Vice President of the US." (OOD)
- Citation: Lazaridou '21
2. **Spurious correlations**
- Image: Cow lying in grass (ID) → Cow lying on beach (OOD)
- Citation: Beery '18
#### Additional Elements
- **ID/OOD Labels**:
- **ID** (In-Distribution): Blue text, left side.
- **OOD** (Out-Of-Distribution): Red text, right side.
- **Arrows**: Connect ID/OOD pairs to their respective subcategories.
- **Color Coding**:
- Blue: Improved robustness subcategories.
- Pink: Persistently challenging subcategories.
- Red: OOD labels.
---
### Detailed Analysis
#### Left Section (Improved Robustness)
1. **Common corruptions**:
- ID: Clear image of a yellow bird on a branch.
- OOD: Blurred version of the same bird.
- Demonstrates robustness to visual noise.
2. **Shifts across space**:
- ID: Natural forest floor texture.
- OOD: Abstract, distorted texture.
- Tests model generalization to spatial variations.
3. **Domain shift**:
- ID: Realistic banana bunch.
- OOD: Close-up of a banana peel.
- Highlights sensitivity to object-level changes.
#### Right Section (Persistently Challenging)
1. **Extrapolation**:
- Textual example: Misattribution of U.S. Vice President (Pence → Harris).
- Illustrates temporal shifts in factual knowledge.
2. **Spurious correlations**:
- ID: Cow lying in grass (natural context).
- OOD: Cow lying on a beach (unrelated context).
- Shows failure to distinguish contextually irrelevant patterns.
---
### Key Observations
- **Visual Contrast**:
- ID/OOD pairs use color (blue/pink) to differentiate robustness categories.
- Arrows spatially ground relationships between concepts.
- **Citations**:
- All examples are attributed to specific studies (e.g., Hendrycks '19, Lazaridou '21).
- **Textual Anomalies**:
- The "Pence/Harris" example is factually incorrect as of 2023 (current VP is Kamala Harris).
---
### Interpretation
The diagram emphasizes the importance of addressing **domain shifts**, **temporal extrapolation**, and **spurious correlations** to improve ML robustness.
- **Improved robustness** (left) focuses on visual and spatial challenges, while **persistently challenging shifts** (right) highlight conceptual and contextual failures.
- The "Pence/Harris" example underscores the risk of models relying on outdated or contextually fragile knowledge.
- **OOD** (Out-Of-Distribution) examples (e.g., blurred bird, banana peel) stress the need for models to handle unseen data distributions.
This framework aligns with Peircean investigative principles, urging scrutiny of how models generalize across time, space, and context. The diagram advocates for robustness testing against both common and rare failure modes.