## Diagram: Shifts in Machine Learning Robustness
### Overview
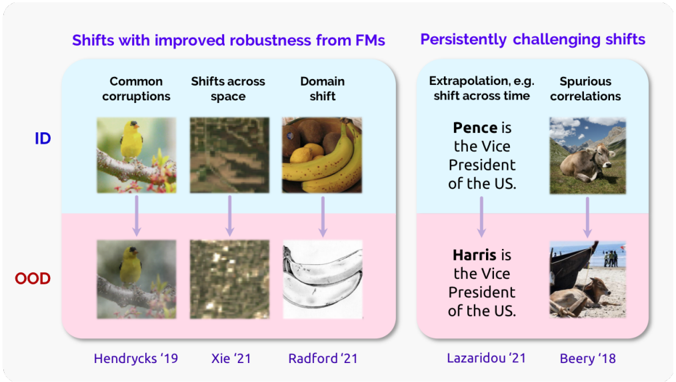
The image is a diagram illustrating different types of shifts in machine learning data, categorized by whether they are handled with improved robustness from Feature Matching (FMs) or remain persistently challenging. The diagram is divided into two rows, representing In-Distribution (ID) and Out-of-Distribution (OOD) data, and several columns, each representing a different type of shift.
### Components/Axes
* **Title:** Shifts with improved robustness from FMs (left side) and Persistently challenging shifts (right side).
* **Rows:**
* ID (In-Distribution): Top row, light blue background.
* OOD (Out-of-Distribution): Bottom row, light pink background.
* **Columns (Left Side):**
* Common corruptions
* Shifts across space
* Domain shift
* **Columns (Right Side):**
* Extrapolation, e.g. shift across time
* Spurious correlations
* **Arrows:** Downward pointing arrows connect each ID image/text to its corresponding OOD image/text.
* **Citations:** Citations are listed below each column, indicating the source of the example.
### Detailed Analysis
**Left Side: Shifts with improved robustness from FMs**
* **Common corruptions:**
* ID: Image of a yellow bird perched on a branch with pink flowers.
* OOD: Image of the same bird, but with a blurred or corrupted appearance.
* Citation: Hendrycks '19
* **Shifts across space:**
* ID: Aerial view of a landscape with fields and roads.
* OOD: A pixelated or distorted version of the same landscape.
* Citation: Xie '21
* **Domain shift:**
* ID: Photograph of a bunch of bananas and some kiwis.
* OOD: A black and white sketch of bananas.
* Citation: Radford '21
**Right Side: Persistently challenging shifts**
* **Extrapolation, e.g. shift across time:**
* ID: Text "Pence is the Vice President of the US."
* OOD: Text "Harris is the Vice President of the US."
* Citation: Lazaridou '21
* **Spurious correlations:**
* ID: Image of a cow in a mountainous landscape.
* OOD: Image of a cow lying on a beach near a boat.
* Citation: Beery '18
### Key Observations
* The left side of the diagram shows shifts that are becoming more manageable due to advancements in Feature Matching (FMs).
* The right side highlights shifts that remain difficult for machine learning models to handle.
* The shift from ID to OOD represents a change in the data distribution that can negatively impact model performance.
### Interpretation
The diagram illustrates the ongoing challenges in machine learning robustness. While models are improving at handling certain types of shifts (e.g., common corruptions, domain shifts), others (e.g., extrapolation, spurious correlations) continue to pose significant problems. The distinction between ID and OOD data is crucial for understanding model generalization and the ability to perform well on unseen data. The examples provided highlight the diverse nature of these shifts, ranging from image corruptions to changes in semantic meaning over time. The diagram suggests that future research should focus on developing methods that can effectively address these persistently challenging shifts to improve the reliability and trustworthiness of machine learning systems.