\n
## Diagram: Robustness to Distribution Shifts in Machine Learning
### Overview
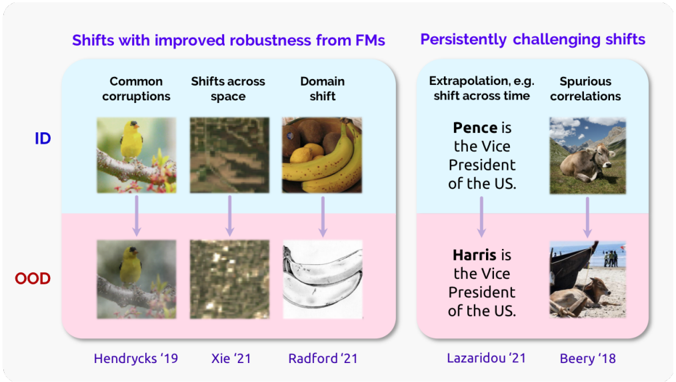
This diagram illustrates different types of distribution shifts encountered in machine learning and their impact on model performance. It categorizes these shifts into those where robustness can be improved with Feature Manipulation (FMs) and those that remain persistently challenging. The diagram visually represents the shift from In-Distribution (ID) data to Out-of-Distribution (OOD) data using image pairs and associated research papers.
### Components/Axes
The diagram is divided into two main sections: "Shifts with improved robustness from FMs" (left) and "Persistently challenging shifts" (right). Each section contains three examples of distribution shifts, each with an ID image, an OOD image, and a corresponding research paper citation. The diagram uses color-coding: blue for ID data and pink for OOD data. Arrows indicate the shift from ID to OOD.
The categories of shifts are:
* **Common corruptions**
* **Shifts across space**
* **Domain shift**
* **Extrapolation, e.g. shift across time**
* **Spurious correlations**
### Detailed Analysis or Content Details
**Section 1: Shifts with improved robustness from FMs**
* **Common corruptions:**
* ID Image: A yellow bird perched on a branch.
* OOD Image: A similar yellow bird, but with a slightly different pose and background.
* Citation: Hendrycks '19
* **Shifts across space:**
* ID Image: A forest scene with visible trees and foliage.
* OOD Image: A desert landscape with sparse vegetation.
* Citation: Xie '21
* **Domain shift:**
* ID Image: A bunch of bananas.
* OOD Image: A metallic, reflective surface resembling a banana peel.
* Citation: Radford '21
**Section 2: Persistently challenging shifts**
* **Extrapolation, e.g. shift across time:**
* ID Image: A portrait of Mike Pence with the text "Pence is the Vice President of the US."
* OOD Image: A portrait of Kamala Harris with the text "Harris is the Vice President of the US."
* Citation: Lazaridou '21
* **Spurious correlations:**
* ID Image: A cow standing in a grassy field.
* OOD Image: A cow on a beach with a boat in the background.
* Citation: Beery '18
### Key Observations
The diagram highlights that certain types of distribution shifts are more easily addressed with techniques like Feature Manipulation. These include common corruptions, shifts across space, and domain shifts. However, shifts involving extrapolation (like changes over time) and spurious correlations pose more significant challenges. The examples demonstrate how seemingly small changes in the input data can lead to incorrect predictions when the model encounters OOD data.
### Interpretation
This diagram illustrates a core challenge in machine learning: the gap between training data (ID) and real-world data (OOD). The categorization of shifts suggests that the nature of the shift significantly impacts the effectiveness of mitigation strategies. Shifts that involve changes in image style or minor variations in the environment can be addressed with techniques that enhance the model's robustness to these changes. However, shifts that require reasoning about time or understanding underlying causal relationships (like spurious correlations) are much harder to handle. The inclusion of research citations indicates ongoing efforts to address these challenges. The example of the Vice President shift is particularly insightful, demonstrating that even a simple change in a key attribute (the person in the image) can lead to a significant performance drop if the model relies on spurious correlations. This diagram is a visual representation of the need for models that can generalize beyond the training distribution and reason about the world in a more robust and reliable way.