\n
## Line Chart: CIFAR-10 Test Accuracy vs. d1
### Overview
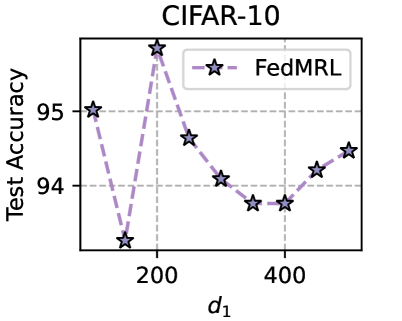
This image presents a line chart illustrating the relationship between a parameter 'd1' and the test accuracy achieved using a method called "FedMRL" on the CIFAR-10 dataset. The chart displays a fluctuating trend, showing how test accuracy changes as 'd1' varies.
### Components/Axes
* **Title:** CIFAR-10 (positioned at the top-center)
* **X-axis:** Labeled as 'd1' (positioned at the bottom-center). The scale ranges from approximately 0 to 500, with markers at 0, 100, 200, 300, 400, and 500.
* **Y-axis:** Labeled as 'Test Accuracy' (positioned at the left-center). The scale ranges from approximately 93 to 96, with gridlines at 93, 94, and 95.
* **Legend:** Located in the top-right corner. It contains:
* Label: "FedMRL"
* Line Style: Dashed line
* Marker: Star symbol
* Color: Purple
### Detailed Analysis
The chart shows a single data series representing "FedMRL". The line is composed of star-shaped markers connected by dashed purple lines. The trend is initially decreasing, then increasing.
Here's a breakdown of approximate data points, reading from left to right:
* d1 = 0: Test Accuracy ≈ 95.2
* d1 = 100: Test Accuracy ≈ 93.2
* d1 = 200: Test Accuracy ≈ 95.8
* d1 = 300: Test Accuracy ≈ 94.5
* d1 = 400: Test Accuracy ≈ 93.5
* d1 = 500: Test Accuracy ≈ 94.3
The line initially drops sharply from d1=0 to d1=100, then rises significantly to d1=200. It then decreases again to d1=400, and finally shows a slight increase to d1=500.
### Key Observations
* The lowest test accuracy is observed around d1 = 100 and d1 = 400.
* The highest test accuracy is observed around d1 = 200.
* The data exhibits significant fluctuations, suggesting a sensitive relationship between 'd1' and test accuracy.
### Interpretation
The chart suggests that the parameter 'd1' has a non-monotonic effect on the test accuracy of the FedMRL method when applied to the CIFAR-10 dataset. Increasing 'd1' does not consistently improve or degrade performance; instead, there are optimal and suboptimal values. The large fluctuations indicate that the model's performance is highly sensitive to the value of 'd1'.
The parameter 'd1' likely represents a hyperparameter or a characteristic of the data distribution used in the Federated Machine Learning (FedMRL) process. The optimal value of 'd1' appears to be around 200, where the model achieves its highest test accuracy. The dips in accuracy at d1=100 and d1=400 could indicate overfitting or underfitting issues, or a mismatch between the data distribution and the model's capacity. Further investigation would be needed to understand the specific meaning of 'd1' and the underlying reasons for these performance variations.