## Histogram: Tensor Distribution Analysis
### Overview
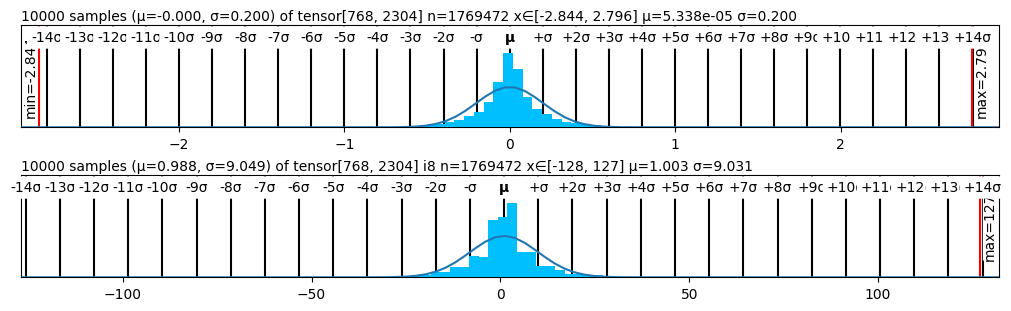
The image presents two histograms, each displaying the distribution of values within a tensor. The top histogram shows a distribution with a mean close to zero and a small standard deviation, while the bottom histogram shows a distribution with a larger mean and standard deviation. Both histograms are overlaid with a Gaussian curve.
### Components/Axes
**Top Histogram:**
* **Title:** 10000 samples (μ=-0.000, σ=0.200) of tensor[768, 2304] n=1769472 x∈[-2.844, 2.796] μ=5.338e-05 σ=0.200
* **X-axis:** Labeled with multiples of the standard deviation (σ) from -14σ to +14σ. Numerical values -2, -1, 0, 1, 2 are also present.
* **Y-axis:** Implicitly represents the frequency or count of values within each bin.
* **Min Value:** Indicated by a vertical red line on the left, labeled "min=-2.84".
* **Max Value:** Indicated by a vertical red line on the right, labeled "max=2.79".
**Bottom Histogram:**
* **Title:** 10000 samples (μ=0.988, σ=9.049) of tensor[768, 2304] i8 n=1769472 x∈[-128, 127] μ=1.003 σ=9.031
* **X-axis:** Labeled with multiples of the standard deviation (σ) from -14σ to +14σ. Numerical values -100, -50, 0, 50, 100 are also present.
* **Y-axis:** Implicitly represents the frequency or count of values within each bin.
* **Min Value:** Not explicitly labeled, but implied to be -128.
* **Max Value:** Indicated by a vertical red line on the right, labeled "max=127".
### Detailed Analysis
**Top Histogram:**
* **Distribution:** The histogram is centered around zero, with a narrow spread. The shape resembles a normal distribution.
* **Mean (μ):** Approximately 0.000 (stated as 5.338e-05).
* **Standard Deviation (σ):** 0.200.
* **X Range:** [-2.844, 2.796]
* **Trend:** The data is clustered tightly around the mean, indicating low variability.
**Bottom Histogram:**
* **Distribution:** The histogram is centered slightly to the right of zero, with a wider spread compared to the top histogram.
* **Mean (μ):** Approximately 0.988 (stated as 1.003).
* **Standard Deviation (σ):** 9.049 (stated as 9.031).
* **X Range:** [-128, 127]
* **Trend:** The data is more dispersed, indicating higher variability.
### Key Observations
* Both histograms represent distributions of tensor values.
* The top histogram has a mean close to zero and a small standard deviation, indicating a tightly clustered distribution around zero.
* The bottom histogram has a larger mean and standard deviation, indicating a more dispersed distribution.
* The x-axis of each histogram is marked with multiples of the standard deviation, providing a visual representation of the data's spread.
### Interpretation
The two histograms visualize the distribution of values within two different tensors. The top histogram suggests that the tensor values are centered around zero with low variability, which might indicate a normalized or standardized dataset. The bottom histogram, with its larger mean and standard deviation, suggests a dataset with a wider range of values and a slight positive bias. The "i8" in the title of the bottom histogram suggests that the data type is an 8-bit integer. The tensor dimensions [768, 2304] and the number of elements n=1769472 are the same for both tensors, suggesting they have the same shape but different value distributions.