## Line Graph: Unlabeled Comparison of Two Variables
### Overview
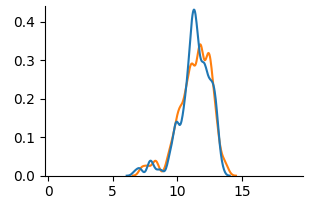
The image depicts a line graph with two distinct data series represented by blue and orange lines. Both lines exhibit a single prominent peak within the range of x=10 to x=13, followed by a sharp decline. The x-axis spans from 0 to 15, while the y-axis ranges from 0.0 to 0.4. No explicit title, legend, or textual annotations are visible in the image.
### Components/Axes
- **X-axis**: Labeled with numerical markers at intervals of 5 (0, 5, 10, 15). No explicit label or units provided.
- **Y-axis**: Labeled with numerical markers at intervals of 0.1 (0.0, 0.1, 0.2, 0.3, 0.4). No explicit label or units provided.
- **Data Series**:
- **Blue Line**: Peaks at approximately (12, 0.4), with a steep ascent and descent.
- **Orange Line**: Peaks at approximately (13, 0.35), with a more gradual ascent and descent.
- **Legend**: Absent. Colors are used without explicit labeling.
### Detailed Analysis
1. **Blue Line**:
- Begins near 0 at x=0.
- Rises sharply to a peak of ~0.4 at x=12.
- Declines steeply to ~0.05 by x=15.
- Intermediate values: ~0.1 at x=10, ~0.3 at x=11.
2. **Orange Line**:
- Begins near 0 at x=0.
- Rises gradually to a peak of ~0.35 at x=13.
- Declines more gradually to ~0.05 by x=15.
- Intermediate values: ~0.15 at x=10, ~0.25 at x=11.
### Key Observations
- Both lines converge near x=15, ending at similar low values (~0.05).
- The blue line exhibits a steeper slope during both ascent and descent compared to the orange line.
- The orange line’s peak occurs 1 unit later (x=13) and is ~12.5% lower in magnitude than the blue line’s peak.
- No overlapping or intersection points are observed between the two lines.
### Interpretation
The graph likely represents a comparison of two variables or processes with similar magnitudes but differing timing and volatility. The blue line’s sharper peak and decline suggest a more rapid or reactive behavior, while the orange line’s gradual changes imply a slower, more sustained process. The convergence at the end may indicate a shared external factor or boundary condition affecting both variables after their respective peaks. The absence of labels or units limits direct interpretation, but the relative trends highlight differences in dynamics between the two series.