## Ecosystem Diagram: Nested Ecosystems
### Overview
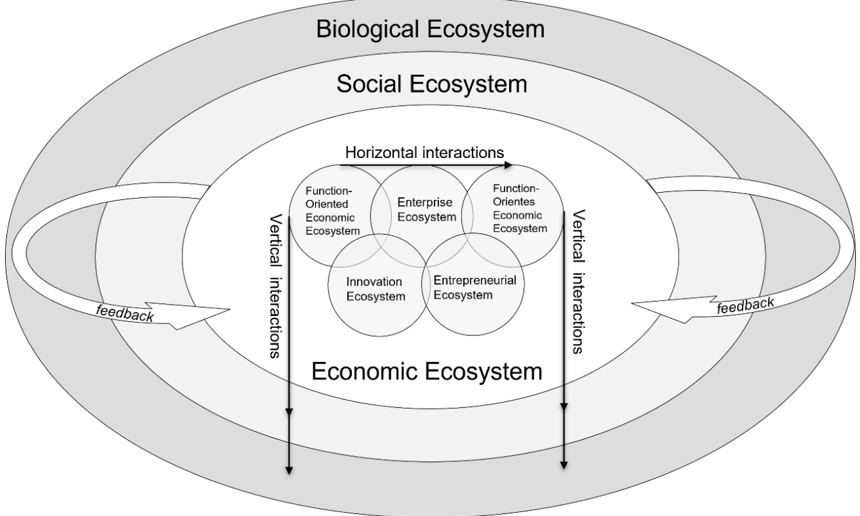
The image is a diagram illustrating nested ecosystems, with the economic ecosystem at the core, surrounded by social and biological ecosystems. The diagram shows interactions between these ecosystems, including horizontal, vertical, and feedback loops.
### Components/Axes
* **Ecosystem Layers (from outermost to innermost):**
* Biological Ecosystem
* Social Ecosystem
* Economic Ecosystem
* **Inner Ecosystem Components (within the Economic Ecosystem):**
* Function-Oriented Economic Ecosystem
* Enterprise Ecosystem
* Function-Oriented Economic Ecosystem (appears twice, mirrored)
* Innovation Ecosystem
* Entrepreneurial Ecosystem
* **Interactions:**
* Horizontal interactions (between the inner ecosystem components)
* Vertical interactions (between the Economic Ecosystem and the outer layers)
* Feedback (loops connecting the outer layers back to the Economic Ecosystem)
### Detailed Analysis or ### Content Details
* **Biological Ecosystem:** The outermost layer, representing the natural environment.
* **Social Ecosystem:** The middle layer, representing societal structures and relationships.
* **Economic Ecosystem:** The innermost layer, representing economic activities and interactions.
* **Inner Ecosystem Components:**
* **Function-Oriented Economic Ecosystem:** Located on the top-left and top-right, partially overlapping with the Enterprise Ecosystem.
* **Enterprise Ecosystem:** Located at the top-center, overlapping with both Function-Oriented Economic Ecosystems, Innovation Ecosystem, and Entrepreneurial Ecosystem.
* **Innovation Ecosystem:** Located on the bottom-left, overlapping with the Enterprise Ecosystem and Entrepreneurial Ecosystem.
* **Entrepreneurial Ecosystem:** Located on the bottom-right, overlapping with the Enterprise Ecosystem and Innovation Ecosystem.
* **Interactions:**
* **Horizontal interactions:** Represented by a double-headed arrow above the inner ecosystem components, indicating interactions between them.
* **Vertical interactions:** Represented by downward arrows on the left and right sides, indicating the influence of the Economic Ecosystem on the outer layers.
* **Feedback:** Represented by curved arrows on the left and right sides, indicating the influence of the outer layers back on the Economic Ecosystem.
### Key Observations
* The diagram emphasizes the interconnectedness of the biological, social, and economic ecosystems.
* The Economic Ecosystem is further broken down into several components, highlighting the complexity of economic activity.
* The diagram illustrates the flow of influence between the different ecosystems, with both vertical and feedback loops.
### Interpretation
The diagram illustrates a systems-thinking approach to understanding ecosystems. It suggests that economic activity is embedded within social and biological contexts, and that these contexts influence and are influenced by economic activity. The horizontal interactions within the Economic Ecosystem highlight the importance of collaboration and competition between different economic actors. The vertical interactions and feedback loops emphasize the need for sustainable economic practices that take into account the impact on the social and biological environments. The diagram suggests that a healthy and sustainable economy requires a holistic approach that considers the interconnectedness of all these ecosystems.