\n
## Diagram: Nested Ecosystems
### Overview
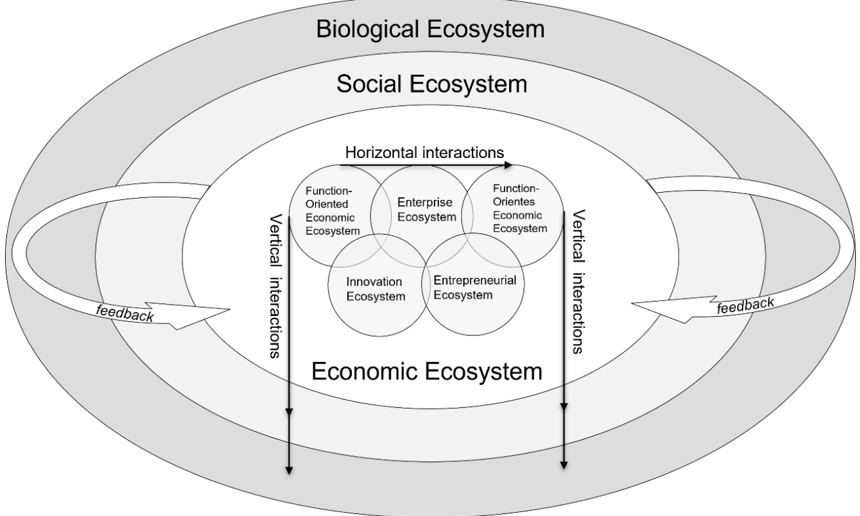
The image is a diagram illustrating the relationships between biological, social, and economic ecosystems. It depicts these ecosystems as nested, overlapping ellipses, with interactions occurring both horizontally and vertically. The core of the diagram focuses on four types of economic ecosystems and their interconnections.
### Components/Axes
The diagram consists of three primary concentric ellipses labeled:
* **Biological Ecosystem** (outermost, light gray)
* **Social Ecosystem** (middle, darker gray)
* **Economic Ecosystem** (innermost, white)
Within the Economic Ecosystem ellipse, there is a Venn diagram representing four interconnected ecosystems:
* **Function-Oriented Economic Ecosystem**
* **Enterprise Ecosystem**
* **Innovation Ecosystem**
* **Entrepreneurial Ecosystem**
Arrows indicate interactions:
* **Horizontal interactions** (between the four economic ecosystems)
* **Vertical interactions** (between the economic, social, and biological ecosystems)
* **Feedback** (curved arrows connecting the biological and economic ecosystems)
### Detailed Analysis or Content Details
The diagram shows a hierarchical structure. The Biological Ecosystem encompasses the Social Ecosystem, which in turn encompasses the Economic Ecosystem.
The four economic ecosystems overlap significantly, indicating strong interdependencies. Specifically:
* The Enterprise Ecosystem overlaps with both Function-Oriented Economic Ecosystems.
* The Innovation Ecosystem overlaps with the Entrepreneurial Ecosystem.
* All four ecosystems have a central overlapping region.
The "Vertical interactions" are represented by two large arrows pointing up and down, connecting the Economic Ecosystem to the Social and Biological Ecosystems.
The "Horizontal interactions" label is positioned above the four economic ecosystems, indicating interactions between them.
"Feedback" is indicated by two curved arrows, one on the left and one on the right, connecting the Economic Ecosystem to the Biological Ecosystem, suggesting a cyclical relationship.
### Key Observations
The diagram emphasizes the interconnectedness of biological, social, and economic systems. The overlapping economic ecosystems suggest that these areas are not mutually exclusive but rather operate in a complex, integrated manner. The feedback loops highlight the influence of the biological environment on economic activity and vice versa. The diagram does not provide quantitative data, but rather a conceptual model.
### Interpretation
This diagram presents a systems thinking approach to understanding ecosystems. It suggests that economic activity is not isolated but is deeply embedded within social and biological contexts. The overlapping economic ecosystems highlight the blurring lines between different economic models and the importance of collaboration and integration. The feedback loops suggest that sustainability requires considering the broader ecological and social impacts of economic activity. The diagram implies that a holistic understanding of these interconnected systems is crucial for effective decision-making and policy development. The model is conceptual and does not provide specific data points or measurements, but rather a framework for analyzing relationships. The diagram is a qualitative representation of complex interactions, rather than a quantitative analysis.