## Nested Ecosystem Interaction Diagram
### Overview
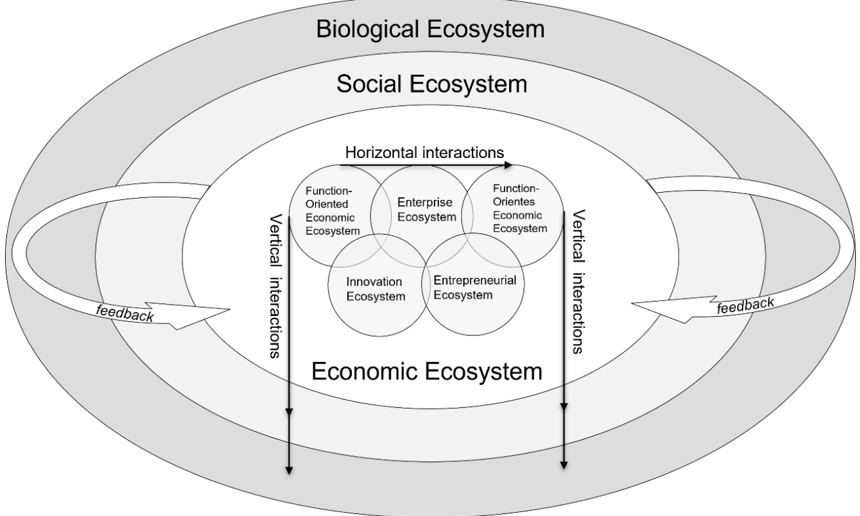
The image is a conceptual diagram illustrating a multi-layered, interconnected system of ecosystems. It uses nested ovals and overlapping circles to represent hierarchical containment and functional relationships, with arrows indicating dynamic interactions and feedback loops between the layers.
### Components/Axes
The diagram is structured into three primary concentric ovals, from outermost to innermost:
1. **Biological Ecosystem** (outermost oval, light gray fill)
2. **Social Ecosystem** (middle oval, white fill)
3. **Economic Ecosystem** (innermost oval, white fill)
Within the **Economic Ecosystem**, there are five overlapping circles representing sub-ecosystems:
* **Function-Oriented Economic Ecosystem** (appears twice, top-left and top-right)
* **Enterprise Ecosystem** (top-center)
* **Innovation Ecosystem** (bottom-left)
* **Entrepreneurial Ecosystem** (bottom-right)
**Interaction Arrows:**
* **Horizontal interactions:** A single, straight, double-headed arrow runs horizontally across the top of the Economic Ecosystem, connecting the two "Function-Oriented Economic Ecosystem" circles.
* **Vertical interactions:** Two straight, double-headed arrows run vertically along the left and right sides of the Economic Ecosystem, connecting the upper and lower sub-ecosystem circles.
* **Feedback:** Two large, curved, hollow arrows originate from the outer edge of the **Social Ecosystem** oval and point inward toward the **Economic Ecosystem**. One is on the left side, and one is on the right side. Both are labeled "feedback".
### Detailed Analysis
**Spatial Layout and Text Transcription:**
* **Top Region (Biological Ecosystem):** The text "Biological Ecosystem" is centered at the top of the outermost oval.
* **Middle Region (Social Ecosystem):** The text "Social Ecosystem" is centered within the middle oval, below the "Biological Ecosystem" label.
* **Central Region (Economic Ecosystem & Sub-ecosystems):**
* The label "Economic Ecosystem" is centered at the bottom of the innermost oval.
* The five sub-ecosystem circles are clustered in the center of the Economic Ecosystem oval.
* The text "Horizontal interactions" is placed above the horizontal arrow.
* The text "Vertical interactions" is placed vertically alongside each of the two vertical arrows (once on the left, once on the right).
* **Feedback Arrows:** The word "feedback" is written inside each of the two large, curved arrows that bridge the Social and Economic Ecosystems.
**Relationships and Flow:**
The diagram depicts a hierarchical and interactive system:
1. The **Biological Ecosystem** contains the **Social Ecosystem**, which in turn contains the **Economic Ecosystem**. This suggests a foundational dependency where the economy exists within society, which itself exists within the broader biological environment.
2. The **Economic Ecosystem** is not monolithic but is composed of specialized, overlapping sub-systems (Function-Oriented, Enterprise, Innovation, Entrepreneurial).
3. **Horizontal interactions** connect similar functional components across the economic system.
4. **Vertical interactions** connect different types of economic components (e.g., linking function-oriented systems with innovation/entrepreneurial systems).
5. **Feedback loops** flow from the Social Ecosystem into the Economic Ecosystem, indicating that social dynamics, needs, or structures influence and shape economic activities.
### Key Observations
* **Nested Hierarchy:** The primary structure is one of containment (Biological > Social > Economic).
* **Overlapping Sub-systems:** The sub-ecosystems within the Economic layer are not isolated; their circles overlap, indicating integration and shared functions.
* **Bidirectional Interactions:** All labeled interaction arrows (Horizontal, Vertical) are double-headed, emphasizing mutual influence rather than one-way causation.
* **Asymmetric Feedback:** The feedback arrows are explicitly shown flowing from the Social to the Economic layer, but not in the reverse direction in this diagram. The connection to the Biological layer is implied by containment but not shown with an explicit interaction arrow.
### Interpretation
This diagram presents a systems-thinking view of how economies are embedded within broader societal and biological contexts. It argues that economic activity is not an independent force but is:
1. **Constrained and enabled** by the social structures and norms that surround it (the Social Ecosystem).
2. **Ultimately dependent** on the biological world for resources and life-support systems (the Biological Ecosystem).
3. **Internally complex**, driven by the interplay between established functions, enterprises, new innovations, and entrepreneurial ventures.
The "feedback" arrows are critical; they suggest that economic outputs and activities generate social consequences (e.g., inequality, community change, cultural shifts) which then feed back to reshape the economic system itself. The absence of a direct "feedback" arrow to the Biological Ecosystem might be an oversight or could imply that the biological impact is mediated through the social layer. The model emphasizes that to understand economic phenomena, one must analyze the interactions *within* the economic sub-systems and the vertical/horizontal linkages between them, as well as the crucial feedback from the social sphere. It is a framework for analyzing sustainability, innovation policy, or economic development through a holistic, multi-layered lens.