\n
## Diagram: Maze/Pathfinding Problem
### Overview
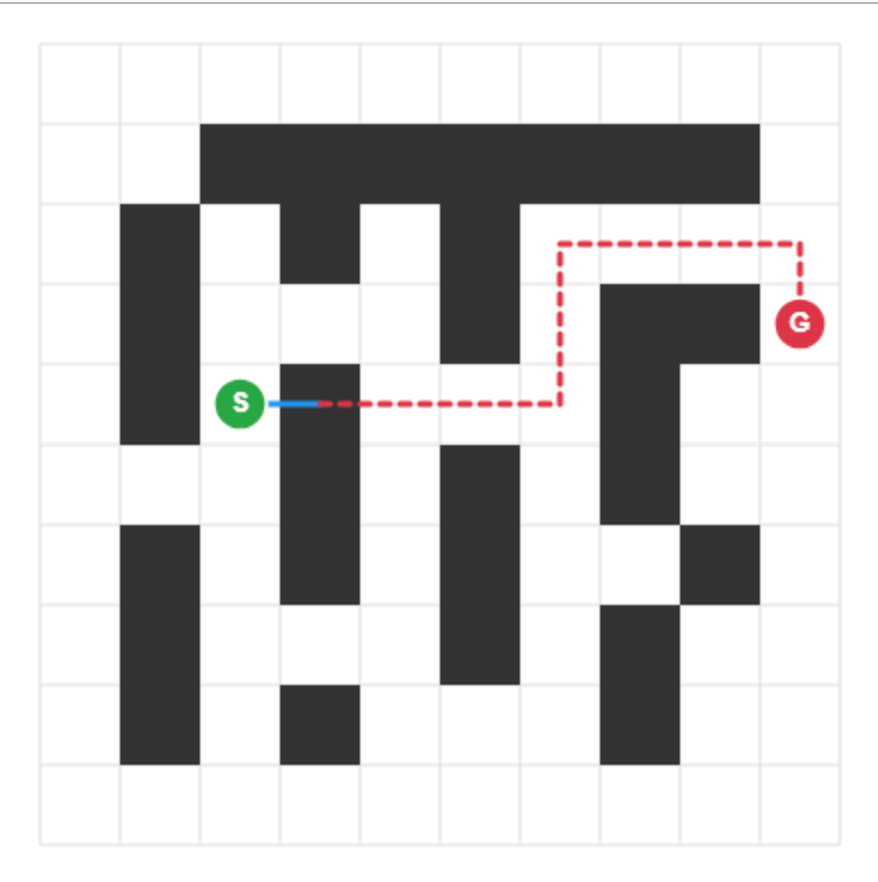
The image depicts a grid-based maze or pathfinding problem. The maze consists of black blocks obstructing movement on a white grid. A starting point 'S' and a goal point 'G' are marked. A dashed red line indicates a possible path from 'S' to 'G'.
### Components/Axes
- **Grid:** A square grid forms the background. The grid lines are faint and appear to be 10x10 or similar.
- **Black Blocks:** Dark gray/black rectangular blocks represent obstacles within the grid.
- **Start Point (S):** A green circle labeled 'S' marks the beginning of the path. Located in the bottom-left quadrant.
- **Goal Point (G):** A red circle labeled 'G' marks the destination. Located in the top-right quadrant.
- **Path:** A dashed red line connects the 'S' and 'G' points, illustrating a potential solution path.
### Detailed Analysis or Content Details
The maze is approximately 10 units wide and 10 units high. The black blocks are arranged in a complex pattern, creating a challenging path.
The path indicated by the dashed red line appears to follow these approximate coordinates (assuming the bottom-left corner is (0,0)):
- Start (S): Approximately (1,1)
- Intermediate points: (2,1), (2,2), (3,2), (4,2), (4,3), (5,3), (6,3), (6,4), (7,4), (8,4), (8,5), (7,5), (7,6), (8,6), (9,6)
- Goal (G): Approximately (9,8)
The path is not necessarily the shortest path, but a feasible route through the maze.
### Key Observations
- The maze is relatively dense with obstacles, requiring careful navigation.
- The path shown is not a straight line, indicating the need to maneuver around the blocks.
- The 'S' and 'G' points are positioned in opposite corners of the grid, increasing the path length.
- The dashed line path is not perfectly aligned with the grid lines, suggesting it's a visual aid rather than a precise coordinate-based path.
### Interpretation
This diagram represents a classic pathfinding problem, commonly encountered in computer science and robotics. The goal is to find a sequence of moves from the start point to the goal point, avoiding the obstacles. The dashed red line suggests a solution has been found, or is being proposed. The complexity of the maze indicates a non-trivial problem, potentially requiring algorithms like A* search, Dijkstra's algorithm, or similar pathfinding techniques to solve efficiently. The diagram could be used to illustrate the concept of pathfinding, demonstrate the effectiveness of a particular algorithm, or serve as a test case for pathfinding implementations. The absence of numerical data beyond the grid structure suggests the focus is on the visual representation of the problem and a potential solution, rather than quantitative analysis of path length or efficiency.