\n
## Diagram: Priority-Based Input to Target Transformation
### Overview
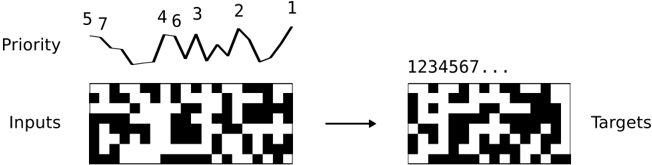
The image depicts a diagram illustrating a process where "Inputs" are transformed into "Targets" based on a "Priority" signal. The priority is represented by a fluctuating line graph, and the inputs and targets are shown as binary matrices (grids of black and white squares). An arrow indicates the transformation direction.
### Components/Axes
* **Priority:** A line graph positioned at the top of the diagram. The x-axis is labeled with numbers 1 through 7, indicating discrete time steps or iterations. The y-axis is unlabeled, representing the priority value.
* **Inputs:** A binary matrix (approximately 8x8) located on the left side of the diagram. The matrix consists of black and white squares.
* **Targets:** A binary matrix (approximately 8x8) located on the right side of the diagram. Similar to the inputs, it consists of black and white squares.
* **Arrow:** A horizontal arrow pointing from the "Inputs" matrix to the "Targets" matrix, indicating the direction of transformation.
### Detailed Analysis or Content Details
* **Priority Line Graph:** The line graph starts at a high value (approximately 7) and decreases to a low value (approximately 2), then increases again to a value of approximately 1. The line fluctuates significantly between these values. Specific approximate values at each x-axis point are:
* x=1: y ≈ 1
* x=2: y ≈ 2
* x=3: y ≈ 3
* x=4: y ≈ 6
* x=5: y ≈ 7
* x=6: y ≈ 4
* x=7: y ≈ 5
* **Inputs Matrix:** The input matrix contains a seemingly random distribution of black and white squares. There is no obvious pattern.
* **Targets Matrix:** The target matrix also contains a seemingly random distribution of black and white squares. There are some visual differences between the input and target matrices, with some squares changing from black to white and vice versa. The target matrix appears to have slightly fewer black squares than the input matrix.
* **Labels:** The diagram includes the labels "Priority", "Inputs", and "Targets". The x-axis of the priority graph is labeled with the numbers 1 through 7. The targets matrix is labeled with "1234567..."
### Key Observations
* The priority signal fluctuates over time, potentially influencing the transformation from inputs to targets.
* The transformation appears to involve changing the state of some squares in the matrix (from black to white or vice versa).
* The transformation is not a simple copy of the input matrix to the target matrix.
### Interpretation
The diagram likely represents a system where inputs are processed to generate targets, and the processing is guided by a priority signal. The priority signal could represent the importance or relevance of different input features at different time steps. The transformation from inputs to targets could be a form of attention mechanism, where the priority signal determines which input features are emphasized or suppressed during the transformation. The binary matrices could represent feature maps or activation patterns in a neural network. The diagram suggests a dynamic process where the transformation is not static but changes over time based on the priority signal. The "1234567..." label on the targets matrix could indicate a sequential processing or ordering of the targets.
The diagram is conceptual and does not provide specific numerical data or algorithms. It illustrates a general principle of priority-based processing. The lack of a y-axis label on the priority graph makes it difficult to interpret the absolute values of the priority signal.