## Diagram: Priority-Guided Input-to-Target Transformation
### Overview
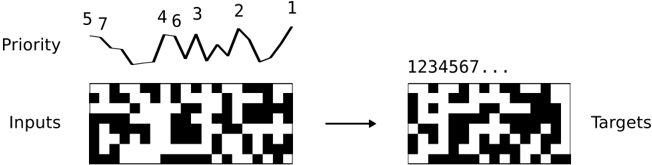
The image is a technical diagram illustrating a process where a set of "Inputs" (represented as a binary grid) is transformed into "Targets" (another binary grid), guided by a "Priority" signal. The diagram is composed of three main visual components arranged vertically: a line graph at the top, an "Inputs" grid on the bottom left, and a "Targets" grid on the bottom right, connected by a rightward-pointing arrow.
### Components/Axes
1. **Priority Graph (Top Section):**
* **Y-axis Label:** "Priority" (text positioned vertically to the left of the graph).
* **X-axis:** Unlabeled, but represents a sequence or progression from left to right.
* **Data Series:** A single, jagged black line that fluctuates up and down.
* **Data Point Labels:** The numbers `1`, `2`, `3`, `4`, `5`, `6`, and `7` are placed directly above specific peaks and troughs of the line. Their approximate positions from left to right are: `5`, `7`, `4`, `6`, `3`, `2`, `1`.
2. **Inputs Grid (Bottom Left):**
* **Label:** "Inputs" (text positioned to the left of the grid).
* **Structure:** An 8x8 grid of squares, each either black or white, forming a binary pattern.
* **Pattern Description:** The pattern is complex. Notable features include a vertical white line in the second column, a cluster of black squares in the top-left corner, and a generally scattered distribution of black and white cells.
3. **Transformation Arrow (Center):**
* A simple, rightward-pointing arrow (`→`) connects the "Inputs" grid to the "Targets" grid, indicating a directional process or function.
4. **Targets Grid (Bottom Right):**
* **Label:** "Targets" (text positioned to the right of the grid).
* **Structure:** An 8x8 grid of squares, identical in dimensions to the Inputs grid.
* **Pattern Description:** The pattern is distinct from the Inputs grid. It appears to have a different distribution of black and white cells, suggesting the output of a transformation.
* **Additional Text:** The sequence "1234567..." is written in a small font directly above the top edge of this grid, aligned to the left.
### Detailed Analysis
* **Priority Line Trend:** The line does not follow a simple increasing or decreasing trend. It starts at a medium-high point (`5`), dips, rises to a peak (`7`), dips again, rises to a lower peak (`4`), dips, rises to a similar peak (`6`), dips, rises to a lower peak (`3`), dips, rises to a low peak (`2`), dips, and finally rises sharply to its highest point (`1`) at the far right. The trend is oscillatory with an overall downward drift in peak height from left to right, except for the final point (`1`).
* **Grid Content:** The grids contain no embedded text, only binary visual data. The "1234567..." text above the Targets grid is separate and likely serves as an index or label for the columns or a sequence related to the priority numbers.
### Key Observations
1. **Non-Sequential Priority Labels:** The priority numbers (`1` through `7`) are not ordered sequentially along the x-axis. Their placement (`5, 7, 4, 6, 3, 2, 1`) suggests they label specific events or features in the process timeline, with `1` being the final or most important.
2. **Visual Complexity:** Both the Inputs and Targets grids are dense, non-repeating binary patterns, indicating a complex data transformation rather than a simple geometric operation.
3. **Spatial Separation:** The Priority graph is visually and spatially separated from the data grids, implying it is a control signal or metadata guiding the transformation shown below.
### Interpretation
This diagram likely represents a conceptual model for a **priority-based or attention-guided data processing task**, common in fields like machine learning, signal processing, or computational neuroscience.
* **What it suggests:** The "Priority" line acts as a time-varying weight or importance signal. The transformation from "Inputs" to "Targets" is not static; it is dynamically influenced by this priority signal. The numbers `1-7` may mark key decision points, features, or iterations where the priority value was particularly significant.
* **How elements relate:** The priority graph (the "why" or "how much") governs the function that maps the input data pattern to the output target pattern. The arrow represents this function. The "1234567..." above the targets could indicate that the output is structured or should be interpreted in relation to those seven key priority points.
* **Notable anomalies:** The most striking feature is the disconnect between the simple, labeled priority curve and the complex, unlabeled binary grids. This suggests the diagram is high-level and conceptual, illustrating the *existence* of a guided process rather than detailing the specific algorithm. The final priority value (`1`) being the highest and at the end of the sequence implies the process culminates in a state of maximum priority or focus.