# Technical Data Extraction: Training Metrics Dashboard
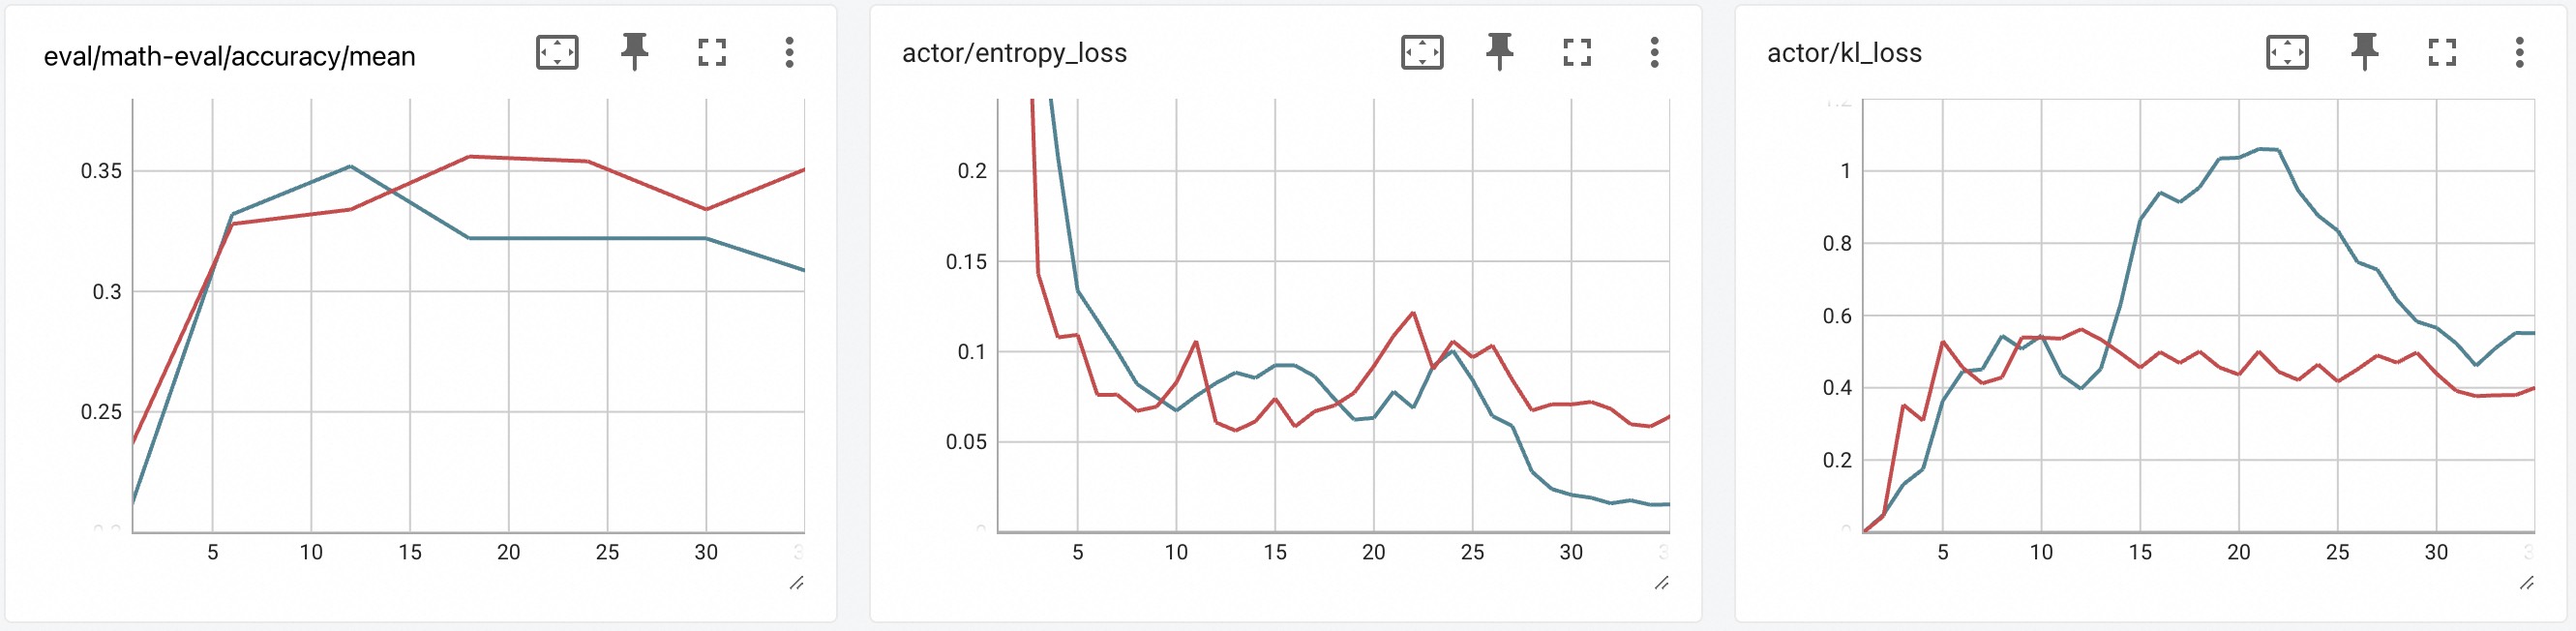
This document provides a detailed extraction of data from three line charts representing machine learning training metrics. The dashboard consists of three panels: Evaluation Accuracy, Entropy Loss, and KL Loss.
Each chart contains two data series:
* **Red Line:** Series A
* **Teal/Blue Line:** Series B
---
## 1. Chart: eval/math-eval/accuracy/mean
**Description:** This chart tracks the mean accuracy on a mathematical evaluation set over time.
* **X-Axis:** Time/Steps (Markers at 5, 10, 15, 20, 25, 30).
* **Y-Axis:** Accuracy (Markers at 0.25, 0.3, 0.35).
### Data Trends and Points
* **Teal Line (Series B):**
* **Trend:** Rapid initial ascent, peaking early, followed by a plateau and a slight decline.
* **Key Points:** Starts near 0.21. Sharp rise to ~0.33 at step 6. Peaks at ~0.35 at step 12. Drops to ~0.32 at step 18 and remains flat until step 30, ending with a slight dip to ~0.31.
* **Red Line (Series A):**
* **Trend:** Steady initial ascent, overtaking the teal line mid-run, and maintaining a higher final accuracy.
* **Key Points:** Starts at ~0.24. Rises to ~0.33 at step 6. Continues a slower climb to peak at ~0.355 at step 18. Maintains ~0.35 until step 25, dips to ~0.335 at step 30, and recovers to ~0.35 at the final step.
---
## 2. Chart: actor/entropy_loss
**Description:** This chart tracks the entropy loss of the actor model, typically used to measure the randomness of actions.
* **X-Axis:** Time/Steps (Markers at 5, 10, 15, 20, 25, 30).
* **Y-Axis:** Loss Value (Markers at 0.05, 0.1, 0.15, 0.2).
### Data Trends and Points
* **Teal Line (Series B):**
* **Trend:** Sharp initial decrease, followed by a period of oscillation between 0.06 and 0.10, ending with a significant drop to a low stable floor.
* **Key Points:** Starts above 0.25 (off-chart). Drops to ~0.13 by step 5. Oscillates around 0.08 between steps 10 and 23. After step 25, it drops sharply to ~0.02 and stabilizes near 0.015.
* **Red Line (Series A):**
* **Trend:** Sharp initial decrease, followed by persistent oscillation with higher variance than the teal line, maintaining a higher final entropy.
* **Key Points:** Starts at ~0.24. Drops to ~0.11 by step 4. Oscillates frequently between 0.05 and 0.12. It shows a notable peak at step 22 (~0.12). Ends the run higher than the teal line at ~0.06.
---
## 3. Chart: actor/kl_loss
**Description:** This chart tracks the Kullback–Leibler (KL) divergence loss, measuring how much the policy changes between updates.
* **X-Axis:** Time/Steps (Markers at 5, 10, 15, 20, 25, 30).
* **Y-Axis:** Loss Value (Markers at 0, 0.2, 0.4, 0.6, 0.8, 1, 1.2).
### Data Trends and Points
* **Teal Line (Series B):**
* **Trend:** Slow initial start, followed by a massive surge/spike in the middle of the training run, then a gradual decline toward a moderate level.
* **Key Points:** Remains below 0.2 until step 5. Rises to ~0.5 at step 8. Experiences a major surge starting at step 13, peaking at ~1.05 between steps 18 and 22. Gradually declines to ~0.55 by the end of the run.
* **Red Line (Series A):**
* **Trend:** Rapid initial rise to a stable plateau with minor fluctuations; significantly more stable than the teal line.
* **Key Points:** Sharp rise from 0 to ~0.5 at step 5. For the remainder of the run (steps 5 through 35), it fluctuates narrowly between 0.4 and 0.55. It ends the run at ~0.4.
---
## Summary of Visual Components
* **Header:** Each panel contains a title (e.g., `actor/kl_loss`) and a toolbar with four icons: "Expand/Fit", "Pin", "Show Grid/Fullscreen", and "Menu (three dots)".
* **Main Chart:** Cartesian coordinate system with light grey grid lines.
* **Footer:** X-axis labels and a resize handle (diagonal lines) in the bottom right corner of each panel.
* **Language:** All text is in English.