## Scatter Plot: Language Model Performance Comparison Across Datasets
### Overview
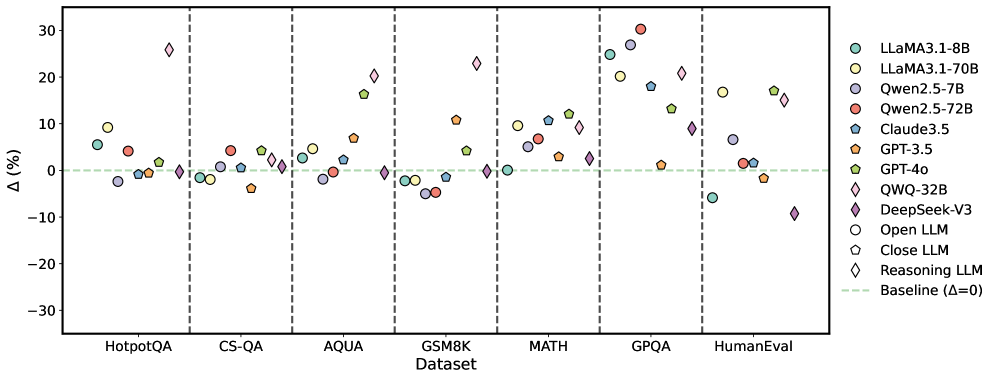
The image is a scatter plot comparing the performance of various large language models (LLMs) across multiple question-answering and reasoning datasets. The y-axis represents percentage change (Δ%) relative to a baseline (Δ=0), while the x-axis categorizes datasets. Each model is represented by a distinct color and shape, with performance variations visualized as data points scattered across the plot.
### Components/Axes
- **X-Axis (Dataset)**: Labeled "Dataset" with categories:
HotpotQA | CS-QA | AQUA | GSM8K | MATH | GPQA | HumanEval
(Separated by vertical dashed lines)
- **Y-Axis (Δ%)**: Labeled "Δ (%)" with a baseline at 0% (green dashed line).
- **Legend**: Located on the right, mapping colors/shapes to models:
- LLaMA3.1-8B (teal circle)
- LLaMA3.1-70B (yellow circle)
- Qwen2.5-7B (purple circle)
- Qwen2.5-72B (red circle)
- Claude3.5 (blue pentagon)
- GPT-3.5 (orange pentagon)
- GPT-4o (green pentagon)
- QWQ-32B (pink diamond)
- DeepSeek-V3 (purple diamond)
- Open LLM (open circle)
- Close LLM (open pentagon)
- Reasoning LLM (open diamond)
- Baseline (Δ=0) (green dashed line)
### Detailed Analysis
- **Dataset Performance**:
- **GPQA**: QWQ-32B (pink diamond) shows the highest improvement (~25%), while DeepSeek-V3 (purple diamond) has the largest decline (~-10%).
- **MATH**: QWQ-32B peaks again (~20%), with GPT-4o (green pentagon) at ~15%.
- **HumanEval**: QWQ-32B drops sharply (~-5%), while DeepSeek-V3 shows the steepest decline (~-15%).
- **GSM8K**: Most models cluster near baseline (0–5%), except QWQ-32B (~10%) and GPT-4o (~12%).
- **Model Trends**:
- **QWQ-32B**: Consistently high performance in GPQA and MATH, but weaker in HumanEval.
- **DeepSeek-V3**: Strong in early datasets (e.g., HotpotQA: ~5%) but declines in later ones.
- **LLaMA3.1-70B**: Stable mid-range performance (~5–10%) across most datasets.
- **GPT-4o**: Strong in GSM8K and MATH (~10–15%), weaker in HumanEval (~-2%).
### Key Observations
1. **QWQ-32B** dominates GPQA and MATH but underperforms in HumanEval.
2. **DeepSeek-V3** shows a U-shaped trend: strong early, weak late.
3. **GPT-4o** excels in reasoning-heavy datasets (GSM8K, MATH) but struggles with HumanEval.
4. **Baseline (Δ=0)**: Most models cluster near this line, indicating mixed performance relative to the baseline.
### Interpretation
The plot highlights dataset-specific strengths and weaknesses of LLMs. QWQ-32B’s performance suggests it is optimized for complex reasoning (GPQA, MATH), while its drop in HumanEval may reflect challenges with nuanced or ambiguous queries. DeepSeek-V3’s decline in later datasets could indicate overfitting or sensitivity to question complexity. GPT-4o’s consistency in reasoning tasks aligns with its reputation for advanced problem-solving, but its HumanEval dip suggests limitations in real-world applicability. The baseline (Δ=0) serves as a critical reference, emphasizing that many models only marginally outperform or underperform the baseline across datasets.