TECHNICAL ASSET FINGERPRINT
8f2f074ee07c8b0b3a7b003d
Click to view fullscreen
Press ESC or click to close
FOUND IN PAPERS
EXPERT: healer-alpha-free VERSION 1
RUNTIME: free/openrouter/healer-alpha
INTEL_VERIFIED
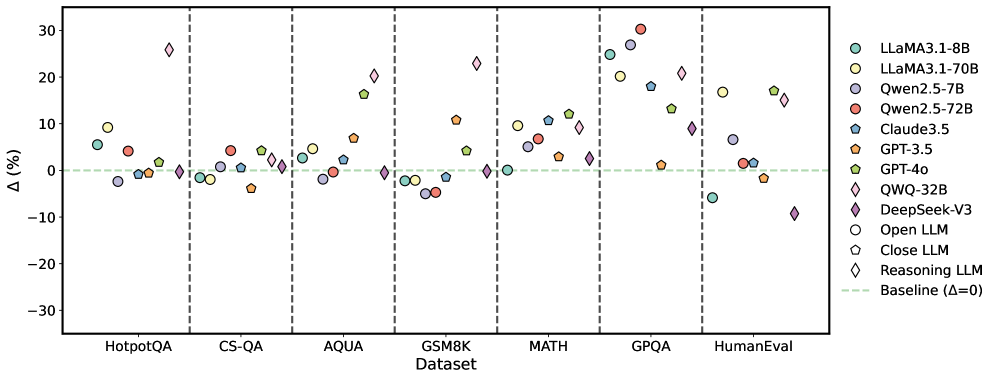
## Scatter Plot: Model Performance Delta (Δ%) Across Datasets
### Overview
The image is a scatter plot comparing the performance change (Δ%) of various large language models (LLMs) across seven different benchmark datasets. The plot uses distinct markers and colors to represent different models and model types (Open, Closed, Reasoning). A baseline at Δ=0 is indicated.
### Components/Axes
* **X-Axis (Categorical):** Labeled "Dataset". Seven datasets are listed from left to right, separated by vertical dashed gray lines:
1. HotpotQA
2. CS-QA
3. AQUA
4. GSM8K
5. MATH
6. GPQA
7. HumanEval
* **Y-Axis (Numerical):** Labeled "Δ(%)". The scale ranges from -30 to 30, with major tick marks at intervals of 10 (-30, -20, -10, 0, 10, 20, 30).
* **Baseline:** A horizontal dashed green line at y=0, labeled "Baseline (Δ=0)" in the legend.
* **Legend (Top-Right Corner):** Contains two sections.
* **Models (by color):**
* LLaMA3.1-8B (Teal circle)
* LLaMA3.1-70B (Light green circle)
* Qwen2.5-7B (Light purple circle)
* Qwen2.5-72B (Red circle)
* Claude3.5 (Blue pentagon)
* GPT-3.5 (Orange pentagon)
* GPT-4o (Green pentagon)
* QWQ-32B (Purple diamond)
* DeepSeek-V3 (Pink diamond)
* **Model Types (by shape):**
* Open LLM (Circle)
* Close LLM (Pentagon)
* Reasoning LLM (Diamond)
### Detailed Analysis
The plot shows the Δ(%) for each model on each dataset. Values are approximate based on visual positioning relative to the y-axis.
**1. HotpotQA:**
* LLaMA3.1-8B (Teal circle): ~ +5%
* LLaMA3.1-70B (Light green circle): ~ +9%
* Qwen2.5-7B (Light purple circle): ~ -2%
* Qwen2.5-72B (Red circle): ~ +4%
* Claude3.5 (Blue pentagon): ~ -1%
* GPT-3.5 (Orange pentagon): ~ 0%
* GPT-4o (Green pentagon): ~ +2%
* QWQ-32B (Purple diamond): ~ 0%
* DeepSeek-V3 (Pink diamond): ~ +26% (Significant outlier)
**2. CS-QA:**
* LLaMA3.1-8B (Teal circle): ~ -1%
* LLaMA3.1-70B (Light green circle): ~ -1%
* Qwen2.5-7B (Light purple circle): ~ 0%
* Qwen2.5-72B (Red circle): ~ +4%
* Claude3.5 (Blue pentagon): ~ +1%
* GPT-3.5 (Orange pentagon): ~ -3%
* GPT-4o (Green pentagon): ~ +4%
* QWQ-32B (Purple diamond): ~ +1%
* DeepSeek-V3 (Pink diamond): ~ +2%
**3. AQUA:**
* LLaMA3.1-8B (Teal circle): ~ +3%
* LLaMA3.1-70B (Light green circle): ~ +2%
* Qwen2.5-7B (Light purple circle): ~ -2%
* Qwen2.5-72B (Red circle): ~ +1%
* Claude3.5 (Blue pentagon): ~ +7%
* GPT-3.5 (Orange pentagon): ~ +7%
* GPT-4o (Green pentagon): ~ +16%
* QWQ-32B (Purple diamond): ~ 0%
* DeepSeek-V3 (Pink diamond): ~ +20%
**4. GSM8K:**
* LLaMA3.1-8B (Teal circle): ~ -2%
* LLaMA3.1-70B (Light green circle): ~ -1%
* Qwen2.5-7B (Light purple circle): ~ -4%
* Qwen2.5-72B (Red circle): ~ -4%
* Claude3.5 (Blue pentagon): ~ -1%
* GPT-3.5 (Orange pentagon): ~ +11%
* GPT-4o (Green pentagon): ~ +5%
* QWQ-32B (Purple diamond): ~ 0%
* DeepSeek-V3 (Pink diamond): ~ +23%
**5. MATH:**
* LLaMA3.1-8B (Teal circle): ~ 0%
* LLaMA3.1-70B (Light green circle): ~ +10%
* Qwen2.5-7B (Light purple circle): ~ +5%
* Qwen2.5-72B (Red circle): ~ +7%
* Claude3.5 (Blue pentagon): ~ +11%
* GPT-3.5 (Orange pentagon): ~ +3%
* GPT-4o (Green pentagon): ~ +12%
* QWQ-32B (Purple diamond): ~ +9%
* DeepSeek-V3 (Pink diamond): ~ +2%
**6. GPQA:**
* LLaMA3.1-8B (Teal circle): ~ +25%
* LLaMA3.1-70B (Light green circle): ~ +20%
* Qwen2.5-7B (Light purple circle): ~ +27%
* Qwen2.5-72B (Red circle): ~ +30% (Highest value in plot)
* Claude3.5 (Blue pentagon): ~ +18%
* GPT-3.5 (Orange pentagon): ~ +1%
* GPT-4o (Green pentagon): ~ +13%
* QWQ-32B (Purple diamond): ~ +21%
* DeepSeek-V3 (Pink diamond): ~ +9%
**7. HumanEval:**
* LLaMA3.1-8B (Teal circle): ~ -6%
* LLaMA3.1-70B (Light green circle): ~ +17%
* Qwen2.5-7B (Light purple circle): ~ +7%
* Qwen2.5-72B (Red circle): ~ +2%
* Claude3.5 (Blue pentagon): ~ +1%
* GPT-3.5 (Orange pentagon): ~ -1%
* GPT-4o (Green pentagon): ~ +17%
* QWQ-32B (Purple diamond): ~ +15%
* DeepSeek-V3 (Pink diamond): ~ -9% (Notable negative outlier)
### Key Observations
1. **GPQA Shows Largest Gains:** All models show a positive Δ on the GPQA dataset, with most clustering between +10% and +30%. This suggests a significant performance improvement for all evaluated models on this specific benchmark.
2. **DeepSeek-V3 Variability:** The DeepSeek-V3 model (pink diamond) shows extreme variability. It has the highest single Δ on HotpotQA (~+26%) and a strong positive on GSM8K (~+23%), but the most negative Δ on HumanEval (~-9%).
3. **Model Type Trends:** "Reasoning LLMs" (diamonds) are not uniformly superior. While DeepSeek-V3 and QWQ-32B show high peaks, they also show dips. "Close LLMs" (pentagons) like GPT-4o and Claude3.5 show consistently moderate to high positive Δs across most datasets.
4. **Dataset Difficulty Signal:** Datasets like CS-QA and AQUA show Δ values clustered closer to zero for many models, suggesting less performance change or a harder baseline. In contrast, GPQA and GSM8K show wider spreads and higher positive values.
5. **HumanEval Divergence:** Performance on HumanEval is highly split. Some models (LLaMA3.1-70B, GPT-4o) show large gains (~+17%), while others (LLaMA3.1-8B, DeepSeek-V3) show losses.
### Interpretation
This chart likely visualizes the performance delta (Δ) of various LLMs compared to a previous version or a baseline model on specific reasoning and knowledge benchmarks. The data suggests:
* **Benchmark-Specific Progress:** The large positive Δs on GPQA and GSM8K indicate that recent model iterations or specific model types have made substantial progress on these quantitative and scientific reasoning tasks.
* **Inconsistent Gains:** Performance improvement is not uniform. A model excelling on one type of task (e.g., DeepSeek-V3 on HotpotQA) may underperform on another (e.g., HumanEval code generation), highlighting the challenge of creating general-purpose models.
* **The "Reasoning LLM" Category is Not Monolithic:** The diamond-shaped markers do not cluster together, indicating that being categorized as a "Reasoning LLM" does not guarantee a specific performance profile. Architectural or training differences within this category lead to divergent outcomes.
* **Scale vs. Specialization:** Larger models (e.g., LLaMA3.1-70B) generally show positive Δs, but smaller specialized models or different architectures can achieve higher peaks on specific tasks, as seen with Qwen2.5-72B on GPQA.
The chart effectively communicates that LLM advancement is multifaceted, with gains concentrated in certain domains and significant variability between models, even within the same size or type category.
DECODING INTELLIGENCE...