## Diagram: Object Relationship Diagram
### Overview
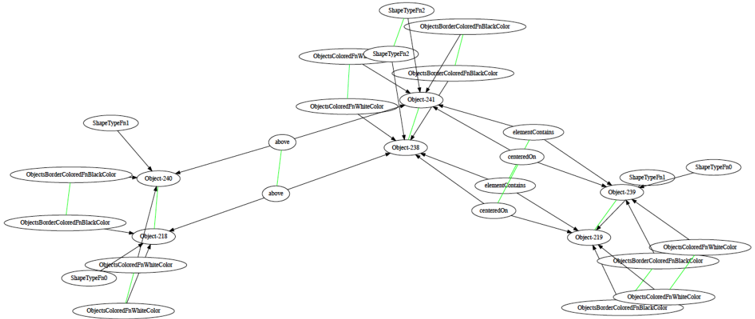
The image is a directed graph diagram illustrating relationships between different objects and their properties. The nodes represent objects or properties, and the edges represent relationships between them. Black arrows indicate a general relationship, while green lines indicate a more specific or defined relationship.
### Components/Axes
* **Nodes:** Represented as rounded rectangles or ovals containing text labels.
* **Edges:** Represented as black arrows indicating the direction of the relationship. Green lines indicate a more specific relationship.
* **Labels:** Text within the nodes describes the object or property. Examples include "ShapeTypePn1", "Object-240", "above", "elementContains", etc.
### Detailed Analysis
The diagram can be broken down into three main clusters: left, center, and right.
**Left Cluster:**
* "ShapeTypePn1" at the top-left connects to "Object-240" with a black arrow.
* "ObjectBorderColoredPnBlackColor" is below "ShapeTypePn1" and connects to "Object-240" with a black arrow.
* "Object-240" connects to "Object-238" with a black arrow.
* "Object-240" connects to "Object-218" with a black arrow.
* "ObjectsBorderColoredPnBlackColor" is below "ObjectBorderColoredPnBlackColor" and connects to "Object-218" with a green line.
* "Object-218" connects to "ObjectColoredPnWhiteColor" and "ShapeTypePn0" with black arrows.
* "ObjectColoredPnWhiteColor" connects to "ObjectColoredPnWhiteColor" with a green line.
**Center Cluster:**
* "ShapeTypePn2" at the top connects to "Object-241" with a black arrow.
* "ObjectsBorderColoredPnBlackColor" is below "ShapeTypePn2" and connects to "Object-241" with a green line.
* "ObjectsColoredPnWhiteColor" is to the left of "ShapeTypePn2" and connects to "Object-241" with a black arrow.
* "ShapeTypeP2" is to the right of "ObjectsColoredPnWhiteColor" and connects to "Object-241" with a green line.
* "ObjectsBorderColoredPnBlackColor" is to the right of "ShapeTypeP2" and connects to "Object-241" with a black arrow.
* "Object-241" connects to "Object-238" with a black arrow.
* "ObjectColoredPnWhiteColor" is below "Object-241" and connects to "Object-238" with a black arrow.
* "Object-238" connects to "Object-219" with a black arrow.
* "above" is to the left of "Object-238" and connects to "Object-238" with a green line.
* "above" is below "above" and connects to "Object-238" with a green line.
* "elementContains" is to the right of "Object-238" and connects to "Object-238" with a black arrow.
* "centeredOn" is below "elementContains" and connects to "Object-238" with a black arrow.
* "elementContains" is below "centeredOn" and connects to "Object-239" with a green line.
* "centeredOn" is below "elementContains" and connects to "Object-239" with a green line.
**Right Cluster:**
* "ShapeTypePn1" at the top-right connects to "Object-239" with a black arrow.
* "ShapeTypePn0" is to the right of "ShapeTypePn1" and connects to "Object-239" with a black arrow.
* "Object-239" connects to "Object-219" with a black arrow.
* "ObjectColoredPnWhiteColor" is below "ShapeTypePn1" and connects to "Object-239" with a black arrow.
* "ObjectsBorderColoredPnBlackColor" is below "ObjectColoredPnWhiteColor" and connects to "Object-219" with a green line.
* "ObjectsColoredPnWhiteColor" is below "ObjectsBorderColoredPnBlackColor" and connects to "Object-219" with a black arrow.
* "ObjectsBorderColoredPnBlackColor" is below "ObjectsColoredPnWhiteColor" and connects to "Object-219" with a green line.
### Key Observations
* "Object-238" appears to be a central node, receiving connections from multiple other nodes.
* The green lines seem to indicate a more direct or specific relationship than the black arrows.
* The diagram shows relationships between object types, properties, and specific object instances (e.g., "Object-240").
### Interpretation
The diagram likely represents a system or model where objects have properties and relationships with each other. The "Object-XXX" nodes could represent specific instances of objects, while the other nodes represent properties or types. The diagram could be used to visualize dependencies or relationships within a software system, knowledge graph, or other complex system. The "above", "elementContains", and "centeredOn" labels suggest spatial or containment relationships between objects. The diagram is a visual representation of a complex network of relationships between different entities.