## Diagram: Object Relationship Graph
### Overview
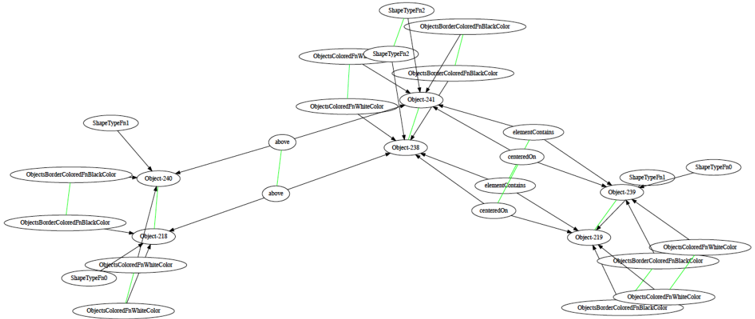
This image is a directed node-link diagram representing a semantic scene graph. It illustrates the hierarchical and spatial relationships between various detected objects (labeled "Object-XXX") and their associated visual properties (such as shape type, color, and border color). The graph appears to be an output from a computer vision or object detection system, mapping how entities are positioned relative to one another and what attributes they possess.
### Components/Axes
The diagram consists of three primary types of elements:
* **Nodes (Ovals):**
* **Object Nodes:** Labeled "Object-218", "Object-219", "Object-238", "Object-239", "Object-240", "Object-241".
* **Property Nodes:** Labeled "ShapeTypeFn0", "ShapeTypeFn1", "ShapeTypeFn2", "ObjectsColoredFnWhiteColor", "ObjectsBorderColoredFnBlackColor".
* **Edges (Lines):**
* **Black Arrows:** Represent directed structural or spatial relationships (e.g., "elementContains", "centeredOn", "above").
* **Green Lines:** Represent undirected associations, typically linking an object to its specific properties (e.g., connecting an object to its color or shape type).
* **Relationship Labels:** Text placed on or near edges defining the nature of the connection: "above", "elementContains", "centeredOn".
### Detailed Analysis
The diagram can be segmented into three distinct clusters:
#### 1. Central Cluster (Hubs)
* **Object-241 (Top Center):** Acts as a primary hub. It is connected to properties: *ShapeTypeFn2*, *ObjectsBorderColoredFnBlackColor*, and *ObjectsColoredFnWhiteColor*. It has directed relationships to Object-238, Object-239, and Object-219.
* **Object-238 (Center):** Acts as a secondary hub. It is connected to Object-241 and has directed relationships to Object-219.
#### 2. Left Cluster
* **Object-240 (Middle Left):**
* Properties: *ShapeTypeFn1*, *ObjectsBorderColoredFnBlackColor*.
* Relationships: Connected to Object-238 via an "above" relationship.
* **Object-218 (Bottom Left):**
* Properties: *ObjectsColoredFnWhiteColor*, *ShapeTypeFn0*, *ObjectsBorderColoredFnBlackColor*.
* Relationships: Connected to Object-240 via an "above" relationship.
#### 3. Right Cluster
* **Object-239 (Middle Right):**
* Properties: *ShapeTypeFn1*, *ShapeTypeFn0*, *ObjectsBorderColoredFnBlackColor*, *ObjectsColoredFnWhiteColor*.
* Relationships: Connected to Object-241 via "elementContains" and "centeredOn".
* **Object-219 (Bottom Right):**
* Properties: *ObjectsColoredFnWhiteColor*, *ObjectsBorderColoredFnBlackColor*.
* Relationships: Connected to Object-238 via "elementContains" and "centeredOn".
### Key Observations
* **Property Consistency:** Almost every object node is linked to an *ObjectsBorderColoredFnBlackColor* property, suggesting a uniform visual style (black borders) across the detected entities.
* **Symmetry:** There is a structural symmetry between the left and right clusters. The left side focuses on "above" relationships, while the right side focuses on "elementContains" and "centeredOn" relationships.
* **Hub-and-Spoke:** The graph is highly centralized around Object-241 and Object-238, which serve as the primary nodes connecting the peripheral objects (240, 218, 239, 219) to the rest of the graph.
* **Green Line Usage:** The green lines consistently denote "has property" relationships, effectively separating attribute data from spatial/structural data (black arrows).
### Interpretation
This diagram represents a **Scene Graph**, a data structure commonly used in Artificial Intelligence and Computer Vision to describe the contents of an image.
* **Hierarchical Structure:** The "elementContains" and "centeredOn" relationships suggest a hierarchy where Object-241 and Object-238 are "parent" or "container" objects, while Object-239 and Object-219 are "child" or "contained" objects.
* **Spatial Reasoning:** The "above" relationships on the left side indicate a vertical spatial arrangement, whereas the "centeredOn" relationships on the right indicate a nested or concentric spatial arrangement.
* **Data Encoding:** The property nodes (e.g., *ShapeTypeFn0*) suggest that the system is classifying objects into specific categories (0, 1, 2) and identifying visual attributes (white color, black border). This is likely a diagnostic view of how an AI model "sees" and organizes a complex image into discrete, related components.