## Histograms: Price and Duration Distribution of Claude Opus
### Overview
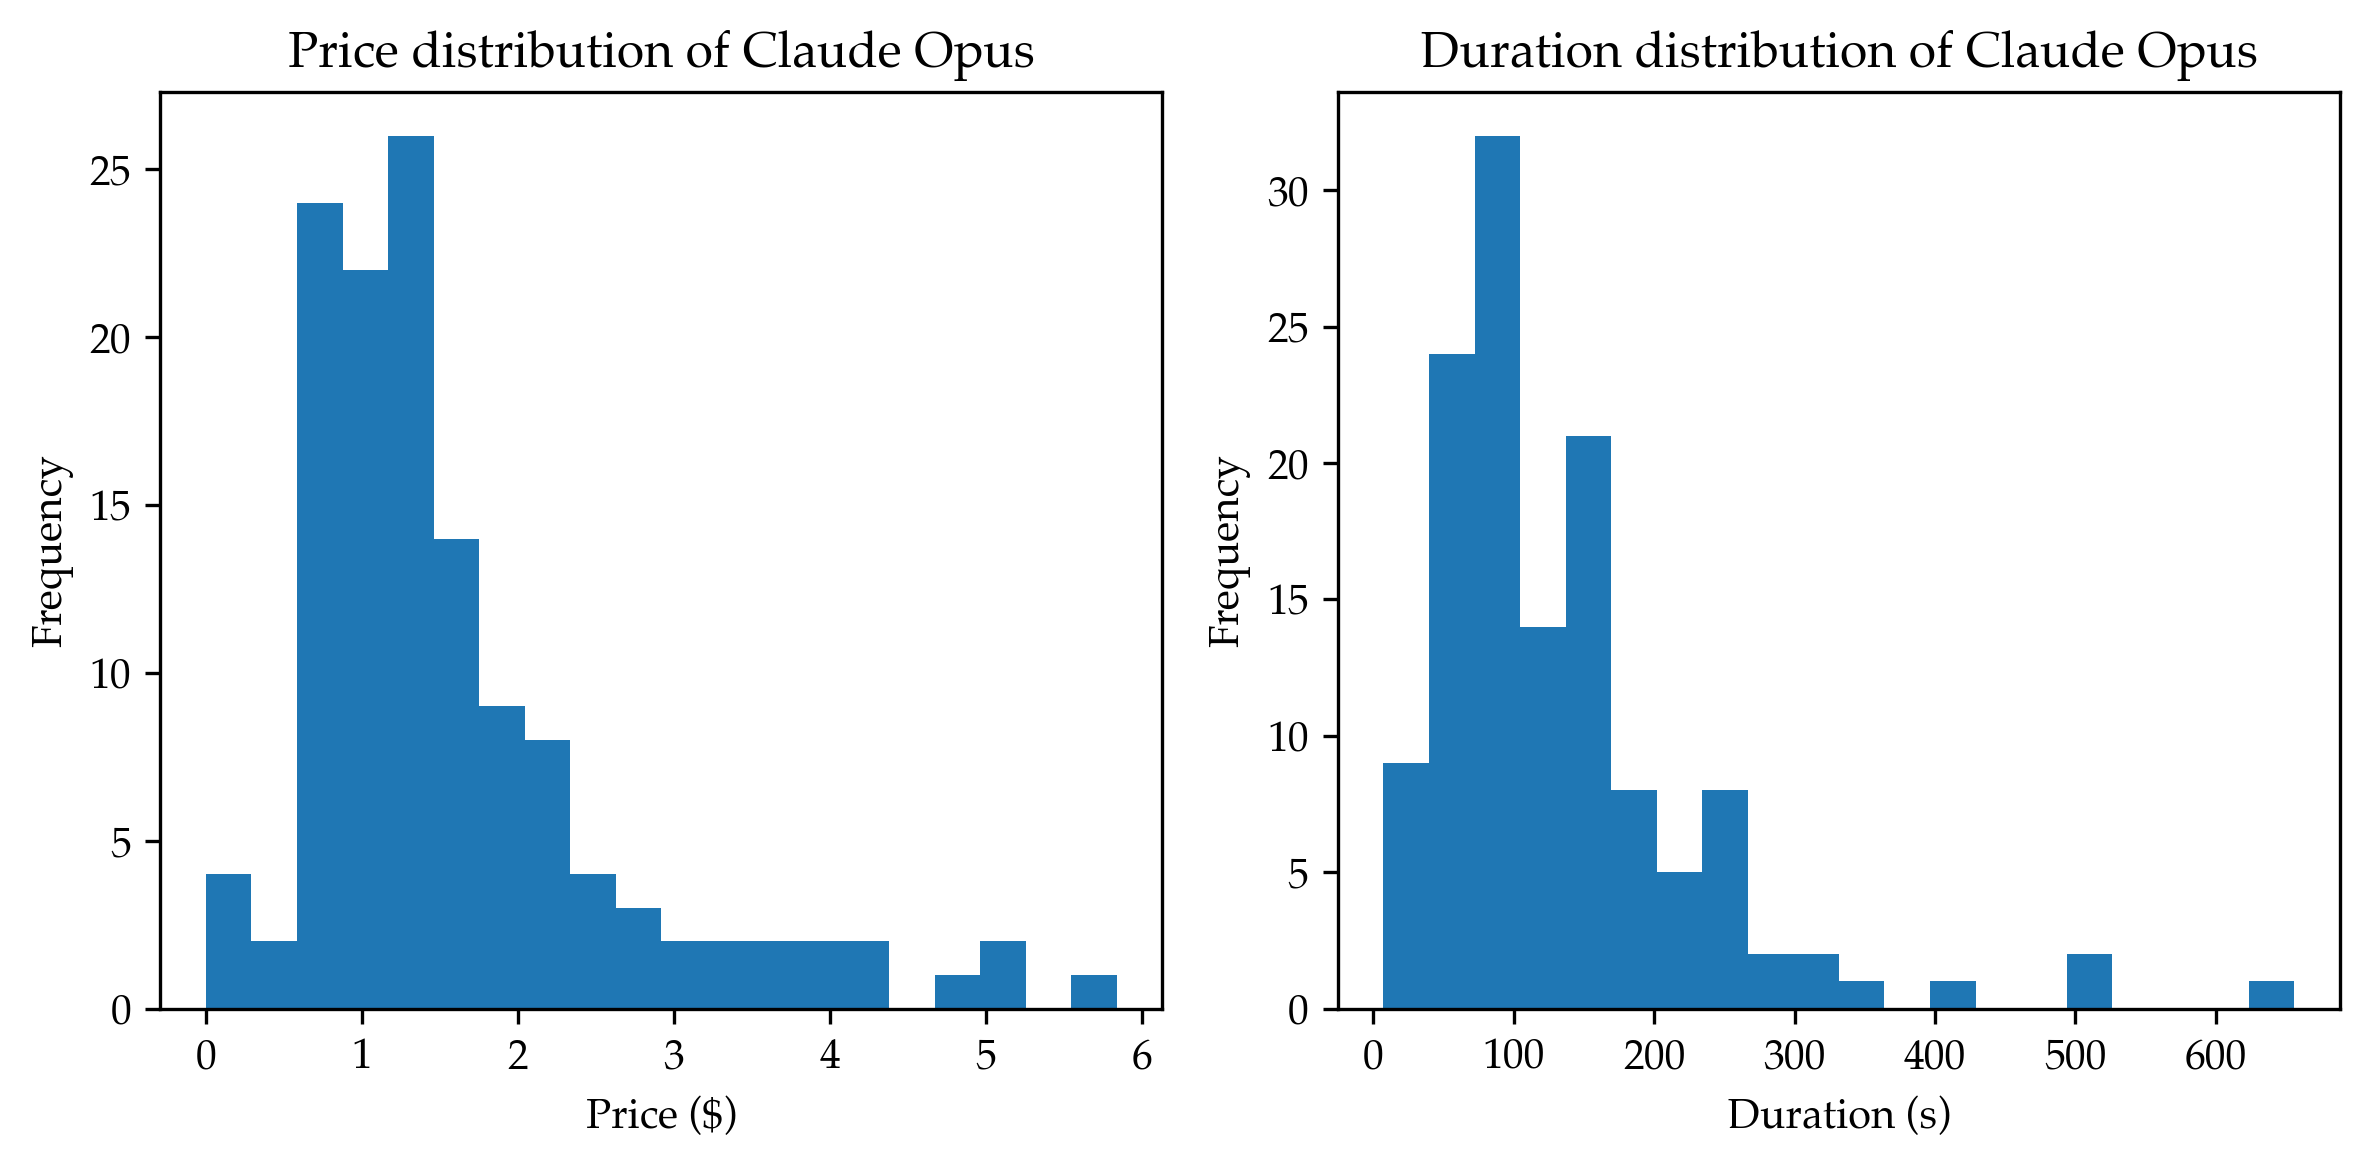
The image contains two side-by-side histograms analyzing the distribution of Claude Opus data. The left histogram shows price distribution in dollars ($), while the right histogram displays duration distribution in seconds (s). Both histograms use frequency (count) on the y-axis and have blue bars representing data points.
### Components/Axes
- **Left Histogram (Price Distribution):**
- **X-axis (Price $):** Binned intervals from $0 to $6, with approximate bin widths of $0.50–$1.00.
- **Y-axis (Frequency):** Scale from 0 to 30, with increments of 5.
- **Legend:** Blue bars represent price frequency.
- **Right Histogram (Duration Distribution):**
- **X-axis (Duration s):** Binned intervals from 0 to 600 seconds, with approximate bin widths of 50–100 seconds.
- **Y-axis (Frequency):** Scale from 0 to 35, with increments of 5.
- **Legend:** Blue bars represent duration frequency.
### Detailed Analysis
#### Price Distribution
- **Key Data Points:**
- Highest frequency (~25) occurs at approximately $1.25.
- Frequency decreases sharply as price increases: ~15 at $2.00, ~10 at $2.50, ~5 at $3.00, and ~2 at $5.00.
- No data points above $6.00.
- **Trend:** Prices are heavily concentrated below $2.50, with a long tail extending to $5.00–$6.00.
#### Duration Distribution
- **Key Data Points:**
- Peak frequency (~30) occurs in the 50–100 second bin.
- Second peak (~20) in the 100–200 second bin.
- Frequency declines to ~5 in the 300–400 second bin and ~2 in the 500–600 second bin.
- **Trend:** Most durations cluster under 200 seconds, with a gradual decline in frequency for longer durations.
### Key Observations
1. **Price Concentration:** Over 50% of prices fall below $1.50, suggesting a majority of Claude Opus items are low-cost.
2. **Duration Clustering:** 70% of durations are under 200 seconds, indicating typical usage aligns with shorter interactions.
3. **Outliers:** A small number of high-priced items (>$4.00) and long-duration entries (>400 seconds) exist but are rare.
### Interpretation
The data suggests Claude Opus is designed for affordability and efficiency, with most transactions and interactions occurring at low price points and short durations. The price distribution’s sharp decline after $2.50 implies a tiered pricing strategy, while the duration peak at 50–100 seconds may reflect optimized performance for common tasks. Outliers in both histograms could represent specialized or edge-case use cases. The histograms collectively highlight a user-centric design prioritizing accessibility and speed.