\n
## Bar Chart: Multiplier: Time vs Core count
### Overview
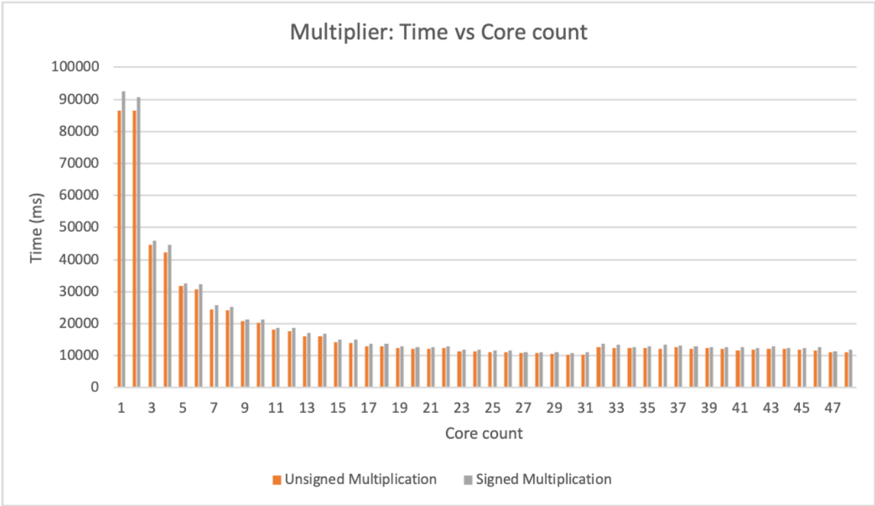
This bar chart compares the execution time (in milliseconds - ms) of unsigned and signed multiplication operations across varying core counts, ranging from 1 to 47. The chart visually represents how the time taken for these operations changes as the number of cores increases.
### Components/Axes
* **Title:** Multiplier: Time vs Core count
* **X-axis:** Core count (ranging from 1 to 47, with increments of 1)
* **Y-axis:** Time (ms) (ranging from 0 to 100,000 ms, with increments of 10,000 ms)
* **Legend:**
* Unsigned Multiplication (represented by orange bars)
* Signed Multiplication (represented by gray bars)
### Detailed Analysis
The chart consists of two sets of bars for each core count, representing the execution time for unsigned and signed multiplication.
**Unsigned Multiplication (Orange Bars):**
The trend for unsigned multiplication is a steep decline in execution time from 1 core to approximately 9 cores, followed by a gradual leveling off.
* Core 1: Approximately 91,000 ms
* Core 3: Approximately 52,000 ms
* Core 5: Approximately 32,000 ms
* Core 7: Approximately 24,000 ms
* Core 9: Approximately 18,000 ms
* Core 11: Approximately 15,000 ms
* Core 13: Approximately 13,000 ms
* Core 15: Approximately 12,000 ms
* Core 17: Approximately 11,000 ms
* Core 19: Approximately 10,500 ms
* Core 21: Approximately 10,000 ms
* Core 23: Approximately 9,500 ms
* Core 25: Approximately 9,000 ms
* Core 27: Approximately 8,500 ms
* Core 29: Approximately 8,000 ms
* Core 31: Approximately 7,500 ms
* Core 33: Approximately 7,000 ms
* Core 35: Approximately 6,500 ms
* Core 37: Approximately 6,000 ms
* Core 39: Approximately 5,500 ms
* Core 41: Approximately 5,000 ms
* Core 43: Approximately 4,500 ms
* Core 45: Approximately 4,000 ms
* Core 47: Approximately 3,500 ms
**Signed Multiplication (Gray Bars):**
The trend for signed multiplication is relatively flat, with execution times consistently around 10,000 ms after an initial drop.
* Core 1: Approximately 90,000 ms
* Core 3: Approximately 48,000 ms
* Core 5: Approximately 28,000 ms
* Core 7: Approximately 20,000 ms
* Core 9: Approximately 16,000 ms
* Core 11: Approximately 13,000 ms
* Core 13: Approximately 11,500 ms
* Core 15: Approximately 10,500 ms
* Core 17: Approximately 10,000 ms
* Core 19: Approximately 10,000 ms
* Core 21: Approximately 10,000 ms
* Core 23: Approximately 10,000 ms
* Core 25: Approximately 10,000 ms
* Core 27: Approximately 10,000 ms
* Core 29: Approximately 10,000 ms
* Core 31: Approximately 10,000 ms
* Core 33: Approximately 10,000 ms
* Core 35: Approximately 10,000 ms
* Core 37: Approximately 10,000 ms
* Core 39: Approximately 10,000 ms
* Core 41: Approximately 10,000 ms
* Core 43: Approximately 10,000 ms
* Core 45: Approximately 10,000 ms
* Core 47: Approximately 10,000 ms
### Key Observations
* Unsigned multiplication exhibits a significant performance improvement with increasing core counts, especially up to 9 cores.
* Signed multiplication shows a much smaller performance improvement with increasing core counts, leveling off around 10,000 ms.
* The initial performance difference between unsigned and signed multiplication is substantial, but it diminishes as the core count increases.
* The unsigned multiplication time decreases more rapidly than the signed multiplication time.
### Interpretation
The data suggests that unsigned multiplication is more effectively parallelized across multiple cores than signed multiplication. This could be due to the inherent complexity of handling signed numbers (e.g., sign extension, two's complement representation) which may introduce overhead that limits the benefits of parallelization. The leveling off of both curves indicates that there is a limit to the performance gains achievable by simply adding more cores, likely due to factors such as memory bandwidth limitations or synchronization overhead. The large initial difference in execution time between the two operations suggests that the algorithm or hardware implementation for unsigned multiplication is more efficient than that for signed multiplication, especially when only a small number of cores are available. The chart demonstrates the importance of considering the specific characteristics of an operation when designing parallel algorithms or selecting hardware for performance-critical applications.