## Bar Chart: Multiplier: Time vs Core count
### Overview
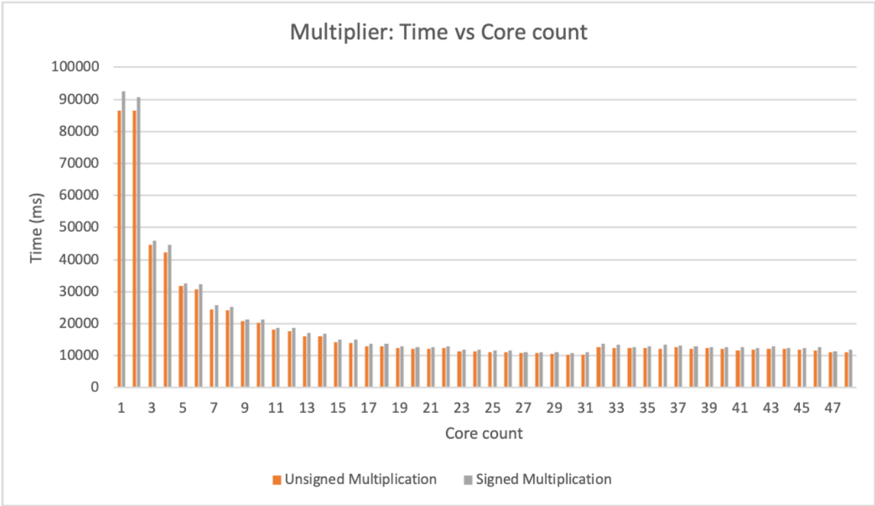
This is a vertical bar chart comparing the execution time (in milliseconds) of two types of multiplication operations—Unsigned and Signed—across a range of CPU core counts from 1 to 47. The chart demonstrates a clear performance scaling trend where increasing the number of cores significantly reduces computation time, with diminishing returns observed at higher core counts.
### Components/Axes
* **Chart Title:** "Multiplier: Time vs Core count" (centered at the top).
* **Y-Axis (Vertical):**
* **Label:** "Time (ms)"
* **Scale:** Linear scale from 0 to 100,000 ms.
* **Major Gridlines:** At intervals of 10,000 ms (0, 10000, 20000, ..., 100000).
* **X-Axis (Horizontal):**
* **Label:** "Core count"
* **Scale:** Discrete values representing the number of CPU cores.
* **Markers:** Labeled at odd-numbered intervals: 1, 3, 5, 7, 9, 11, 13, 15, 17, 19, 21, 23, 25, 27, 29, 31, 33, 35, 37, 39, 41, 43, 45, 47.
* **Legend:**
* **Position:** Centered at the bottom of the chart.
* **Items:**
* **Orange Square:** "Unsigned Multiplication"
* **Gray Square:** "Signed Multiplication"
### Detailed Analysis
The chart displays paired bars for each core count. The left (orange) bar represents "Unsigned Multiplication," and the right (gray) bar represents "Signed Multiplication." For every core count, the signed multiplication time is slightly higher than the unsigned multiplication time.
**Trend Verification:** Both data series exhibit the same visual trend: a steep, near-exponential decay in time as core count increases from 1 to approximately 21, after which the curve flattens into a plateau with very gradual improvement.
**Approximate Data Points (Estimated from chart):**
| Core Count | Unsigned Multiplication (ms) | Signed Multiplication (ms) |
| :--- | :--- | :--- |
| 1 | ~87,000 | ~92,000 |
| 3 | ~85,000 | ~90,000 |
| 5 | ~45,000 | ~46,000 |
| 7 | ~42,000 | ~44,000 |
| 9 | ~32,000 | ~32,000 |
| 11 | ~31,000 | ~32,000 |
| 13 | ~25,000 | ~26,000 |
| 15 | ~24,000 | ~25,000 |
| 17 | ~21,000 | ~22,000 |
| 19 | ~21,000 | ~22,000 |
| 21 | ~19,000 | ~20,000 |
| 23 | ~18,000 | ~19,000 |
| 25 | ~17,000 | ~18,000 |
| 27 | ~16,000 | ~17,000 |
| 29 | ~15,000 | ~16,000 |
| 31 | ~14,000 | ~15,000 |
| 33 | ~13,000 | ~14,000 |
| 35 | ~12,000 | ~13,000 |
| 37 | ~11,000 | ~12,000 |
| 39 | ~11,000 | ~12,000 |
| 41 | ~11,000 | ~12,000 |
| 43 | ~11,000 | ~12,000 |
| 45 | ~11,000 | ~12,000 |
| 47 | ~11,000 | ~12,000 |
*Note: Values from core count 33 onward are very close and difficult to distinguish precisely, hovering in the 11,000-14,000 ms range.*
### Key Observations
1. **Initial Scaling:** The most dramatic performance gain occurs when moving from 1-3 cores to 5-7 cores, where execution time drops by nearly 50%.
2. **Performance Gap:** Signed multiplication consistently takes slightly longer than unsigned multiplication across all core counts. The absolute difference is largest at low core counts (e.g., ~5,000 ms at 1 core) and narrows as time decreases.
3. **Diminishing Returns:** The performance improvement curve flattens significantly after approximately 21 cores. Adding more cores beyond this point yields minimal reduction in execution time.
4. **Plateau Region:** From core count 33 to 47, the times for both operations are nearly constant, suggesting the system has reached a scalability limit for this specific task, likely due to overhead from parallelization, memory bandwidth, or other bottlenecks.
### Interpretation
This chart illustrates the classic principle of parallel computing: distributing a workload across multiple cores reduces total computation time, but not linearly and not indefinitely.
* **What the data suggests:** The multiplication task is highly parallelizable, as evidenced by the strong initial scaling. The consistent gap between signed and unsigned operations indicates that signed multiplication has a slight inherent computational overhead, possibly due to additional logic for handling sign bits.
* **How elements relate:** The x-axis (Core count) is the independent variable being manipulated. The y-axis (Time) is the dependent variable measuring the outcome. The two bar series (Unsigned/Signed) are the conditions being compared under each core count setting.
* **Notable Anomalies/Trends:** The most critical trend is the **knee of the curve** around 21 cores. This represents the optimal point for resource allocation for this specific workload on this specific hardware. Beyond this, allocating more cores is inefficient, as it provides negligible speedup while consuming more power and resources. The plateau from core 33 onward strongly implies a hardware or software bottleneck unrelated to core count has become the limiting factor.