## Bar Chart: Multiplier: Time vs Core count
### Overview
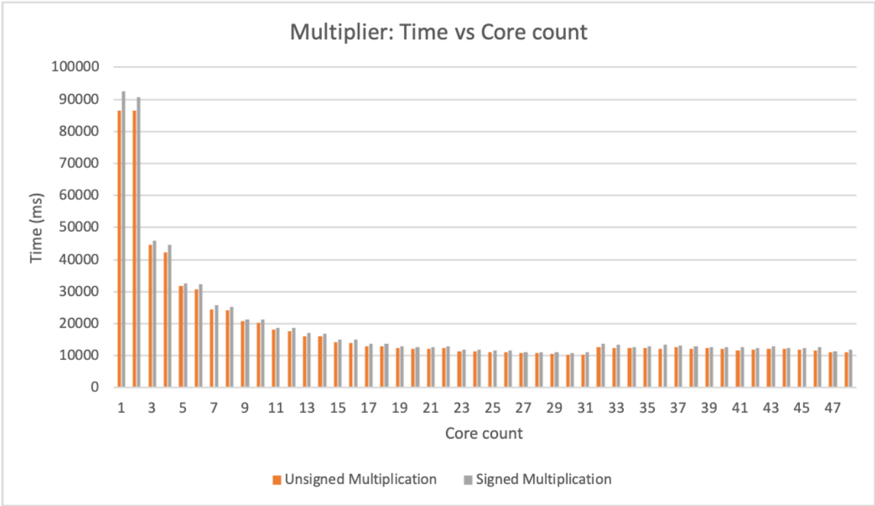
The chart compares computation time (in milliseconds) for unsigned and signed multiplication operations across varying core counts (1 to 47). Two data series are visualized: orange bars represent unsigned multiplication, while gray bars represent signed multiplication. The y-axis scales logarithmically from 0 to 100,000 ms, with the x-axis showing core counts in odd increments (1, 3, 5, ..., 47).
### Components/Axes
- **Title**: "Multiplier: Time vs Core count"
- **X-axis**:
- Label: "Core count"
- Scale: Discrete values from 1 to 47 (odd numbers only)
- **Y-axis**:
- Label: "Time (ms)"
- Scale: 0 to 100,000 ms in 10,000 ms increments
- **Legend**:
- Position: Bottom center
- Entries:
- Orange: "Unsigned Multiplication"
- Gray: "Signed Multiplication"
- **Bars**:
- Grouped by core count (each group contains two bars: orange and gray)
- Heights correspond to time values
### Detailed Analysis
1. **Core Count 1**:
- Unsigned: ~85,000 ms
- Signed: ~90,000 ms
2. **Core Count 3**:
- Unsigned: ~45,000 ms
- Signed: ~47,000 ms
3. **Core Count 5**:
- Unsigned: ~32,000 ms
- Signed: ~34,000 ms
4. **Core Count 7**:
- Unsigned: ~25,000 ms
- Signed: ~26,000 ms
5. **Core Count 9**:
- Unsigned: ~20,000 ms
- Signed: ~21,000 ms
6. **Core Counts 11–47**:
- Both series plateau between ~10,000–15,000 ms, with minor fluctuations (e.g., ~12,000 ms at core count 13, ~11,000 ms at core count 25).
### Key Observations
- **Steep Initial Decline**: Time drops dramatically from core count 1 (90,000 ms) to core count 5 (32,000 ms), then gradually stabilizes.
- **Minimal Difference Between Signed/Unsigned**: Signed operations consistently take ~2–5% longer than unsigned, but the gap narrows as core count increases.
- **Plateau Effect**: Beyond core count 9, performance gains diminish, suggesting diminishing returns at higher core utilization.
### Interpretation
The data demonstrates that increasing core count significantly reduces computation time for multiplication operations, with the most substantial gains occurring at low core counts (1–5). The near-identical performance of signed and unsigned operations implies that sign handling introduces negligible overhead in this implementation. The plateau at higher core counts suggests potential bottlenecks (e.g., memory bandwidth, instruction scheduling) limiting further optimization. This chart highlights the importance of core parallelism in computational efficiency but also underscores the need for architectural improvements to sustain performance gains at scale.