## Line Chart: RAG Performance vs. Source Text Length
### Overview
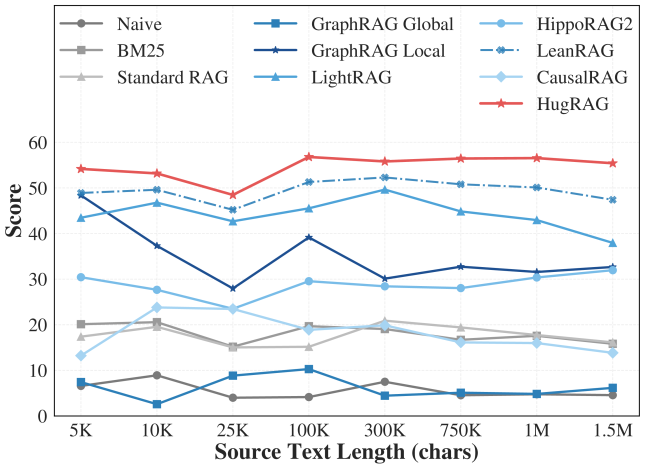
The image is a line chart comparing the performance (Score) of different Retrieval-Augmented Generation (RAG) models against varying lengths of source text (in characters). The chart displays multiple lines, each representing a different RAG model, with the x-axis indicating source text length and the y-axis indicating the performance score.
### Components/Axes
* **Y-axis:** "Score", ranging from 0 to 60, with tick marks at intervals of 10.
* **X-axis:** "Source Text Length (chars)", with values 5K, 10K, 25K, 100K, 300K, 750K, 1M, and 1.5M.
* **Legend:** Located at the top of the chart, listing the RAG models and their corresponding line colors/styles:
* Naive (Gray with circle markers)
* BM25 (Dark Gray with square markers)
* Standard RAG (Light Gray with triangle markers)
* GraphRAG Global (Blue with square markers)
* GraphRAG Local (Dark Blue with star markers)
* LightRAG (Teal with triangle markers)
* HippoRAG2 (Light Blue with circle markers)
* LeanRAG (Blue-Gray dashed line with x markers)
* CausalRAG (Light Blue with diamond markers)
* HugRAG (Red with star markers)
### Detailed Analysis
* **Naive (Gray with circle markers):** The line starts at approximately 8, decreases to approximately 3 at 10K, increases to approximately 5 at 25K, remains relatively flat around 4-5 until 1M, and ends at approximately 6 at 1.5M.
* **BM25 (Dark Gray with square markers):** The line starts at approximately 20, decreases to approximately 17 at 10K, decreases to approximately 15 at 25K, increases to approximately 20 at 100K, decreases to approximately 17 at 300K, remains relatively flat around 16-17 until 1M, and ends at approximately 17 at 1.5M.
* **Standard RAG (Light Gray with triangle markers):** The line starts at approximately 18, increases to approximately 24 at 10K, decreases to approximately 18 at 25K, increases to approximately 20 at 100K, decreases to approximately 18 at 300K, remains relatively flat around 17-18 until 1M, and ends at approximately 17 at 1.5M.
* **GraphRAG Global (Blue with square markers):** The line starts at approximately 8, decreases to approximately 3 at 10K, increases to approximately 9 at 25K, increases to approximately 10 at 100K, decreases to approximately 6 at 300K, remains relatively flat around 5-6 until 1M, and ends at approximately 6 at 1.5M.
* **GraphRAG Local (Dark Blue with star markers):** The line starts at approximately 48, decreases to approximately 38 at 10K, decreases to approximately 28 at 25K, increases to approximately 40 at 100K, decreases to approximately 30 at 300K, increases to approximately 33 at 750K, remains relatively flat around 32-33 until 1.5M.
* **LightRAG (Teal with triangle markers):** The line starts at approximately 44, increases to approximately 47 at 10K, decreases to approximately 43 at 25K, increases to approximately 46 at 100K, decreases to approximately 45 at 300K, remains relatively flat around 45-46 until 1M, and ends at approximately 45 at 1.5M.
* **HippoRAG2 (Light Blue with circle markers):** The line starts at approximately 30, decreases to approximately 28 at 10K, decreases to approximately 24 at 25K, increases to approximately 30 at 100K, increases to approximately 31 at 300K, remains relatively flat around 31-32 until 1M, and ends at approximately 33 at 1.5M.
* **LeanRAG (Blue-Gray dashed line with x markers):** The line starts at approximately 49, increases to approximately 50 at 10K, decreases to approximately 46 at 25K, increases to approximately 52 at 100K, decreases to approximately 51 at 300K, remains relatively flat around 51 until 1M, and ends at approximately 48 at 1.5M.
* **CausalRAG (Light Blue with diamond markers):** The line starts at approximately 14, increases to approximately 24 at 10K, increases to approximately 26 at 25K, increases to approximately 29 at 100K, decreases to approximately 25 at 300K, remains relatively flat around 24-25 until 1M, and ends at approximately 24 at 1.5M.
* **HugRAG (Red with star markers):** The line starts at approximately 54, decreases to approximately 53 at 10K, decreases to approximately 49 at 25K, increases to approximately 57 at 100K, decreases to approximately 56 at 300K, increases to approximately 57 at 750K, remains relatively flat around 57 until 1M, and ends at approximately 55 at 1.5M.
### Key Observations
* HugRAG consistently achieves the highest scores across all source text lengths.
* Naive and GraphRAG Global consistently perform the worst.
* The performance of most RAG models fluctuates with source text length, but HugRAG remains relatively stable.
* There is a general trend of performance increasing from 5K to 100K characters, followed by a slight decrease or stabilization.
### Interpretation
The chart suggests that the HugRAG model is the most robust and effective across different source text lengths compared to the other RAG models tested. The performance fluctuations observed in other models indicate that their effectiveness may be more sensitive to the length of the input text. The consistently low performance of Naive and GraphRAG Global suggests that these models may require further optimization or are not well-suited for the tested task. The initial increase in performance up to 100K characters for some models could indicate an optimal range for source text length, beyond which performance plateaus or slightly declines.