\n
## Line Chart: RAG Model Performance vs. Source Text Length
### Overview
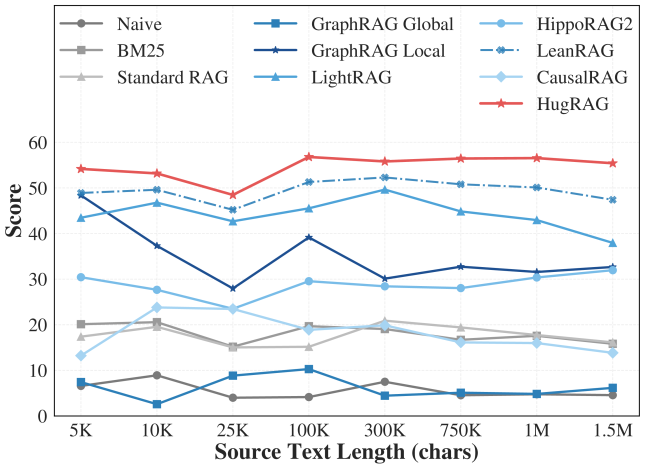
This line chart compares the performance (Score) of several Retrieval-Augmented Generation (RAG) models across varying source text lengths, measured in characters. The chart displays how the score of each model changes as the length of the input text increases.
### Components/Axes
* **X-axis:** Source Text Length (chars) - Scale: 5K, 10K, 25K, 100K, 300K, 750K, 1M, 1.5M
* **Y-axis:** Score - Scale: 0 to 60
* **Legend (Top Center):** Contains labels for each data series (model):
* Naive (Grey)
* BM25 (Light Grey)
* Standard RAG (Dark Grey)
* GraphRAG Global (Blue)
* GraphRAG Local (Dark Blue)
* LightRAG (Teal)
* HippoRAG2 (Light Blue)
* LeanRAG (Purple)
* CausalRAG (Sky Blue)
* HugRAG (Red)
### Detailed Analysis
Here's a breakdown of each line's trend and approximate data points, cross-referencing with the legend colors:
* **Naive (Grey):** Starts at approximately 17 at 5K, fluctuates around 15-20 until 750K, then decreases to approximately 10 at 1.5M.
* **BM25 (Light Grey):** Starts at approximately 15 at 5K, remains relatively flat around 15-20 throughout, ending at approximately 12 at 1.5M.
* **Standard RAG (Dark Grey):** Starts at approximately 18 at 5K, remains relatively flat around 15-20 throughout, ending at approximately 14 at 1.5M.
* **GraphRAG Global (Blue):** Starts at approximately 48 at 5K, decreases to around 42 at 25K, then increases to approximately 50 at 100K, fluctuates around 45-50 until 1M, and ends at approximately 46 at 1.5M.
* **GraphRAG Local (Dark Blue):** Starts at approximately 42 at 5K, decreases to around 38 at 25K, increases to approximately 45 at 100K, then decreases to approximately 40 at 750K, and ends at approximately 42 at 1.5M.
* **LightRAG (Teal):** Starts at approximately 28 at 5K, decreases to approximately 25 at 25K, increases to approximately 35 at 100K, then decreases to approximately 30 at 1.5M.
* **HippoRAG2 (Light Blue):** Starts at approximately 22 at 5K, increases to approximately 32 at 100K, then fluctuates around 30-35 until 1.5M.
* **LeanRAG (Purple):** Starts at approximately 52 at 5K, decreases to approximately 45 at 25K, then increases to approximately 55 at 100K, and remains relatively stable around 45-55 until 1.5M.
* **CausalRAG (Sky Blue):** Starts at approximately 30 at 5K, decreases to approximately 27 at 25K, increases to approximately 33 at 100K, then fluctuates around 30-35 until 1.5M.
* **HugRAG (Red):** Starts at approximately 55 at 5K, increases to a peak of approximately 60 at 100K, then decreases slightly to approximately 57 at 1.5M.
### Key Observations
* HugRAG consistently performs the best across all source text lengths.
* Naive, BM25, and Standard RAG consistently perform the worst.
* GraphRAG Global and LeanRAG show relatively stable performance across different text lengths.
* Most models exhibit a peak performance around the 100K-300K source text length range.
* Performance generally decreases for the Naive, BM25, and Standard RAG models as the source text length increases.
### Interpretation
The data suggests that HugRAG is the most robust model for handling varying source text lengths, maintaining a high score even with longer inputs. The poorer performance of Naive, BM25, and Standard RAG models with increasing text length indicates that these methods struggle with longer contexts. The peak performance observed around 100K-300K for many models suggests an optimal text length for effective retrieval and generation. The differences between GraphRAG Global and Local suggest that the scope of the graph used for retrieval impacts performance. Overall, the chart demonstrates the importance of choosing a RAG model that can effectively handle the expected length of the source text to maximize performance. The consistent high performance of HugRAG suggests it may be a good choice for applications with variable input lengths.